Hotelling’s Minimum Differentiation Principle in a Continuous-Time Experiment with Price and Location Choices
Economics
Hotelling’s famous vendors may have no stable equilibrium, but in the lab they still gravitate toward one another, clustering near the center while continually adjusting prices and positions. The experiment reveals a market shaped less by a final resting point than by the speed of movement itself, with faster adjustment sometimes encouraging coordination and sometimes unsettling it.
Author

Curtis Kephart

Published

Apr 27, 2023


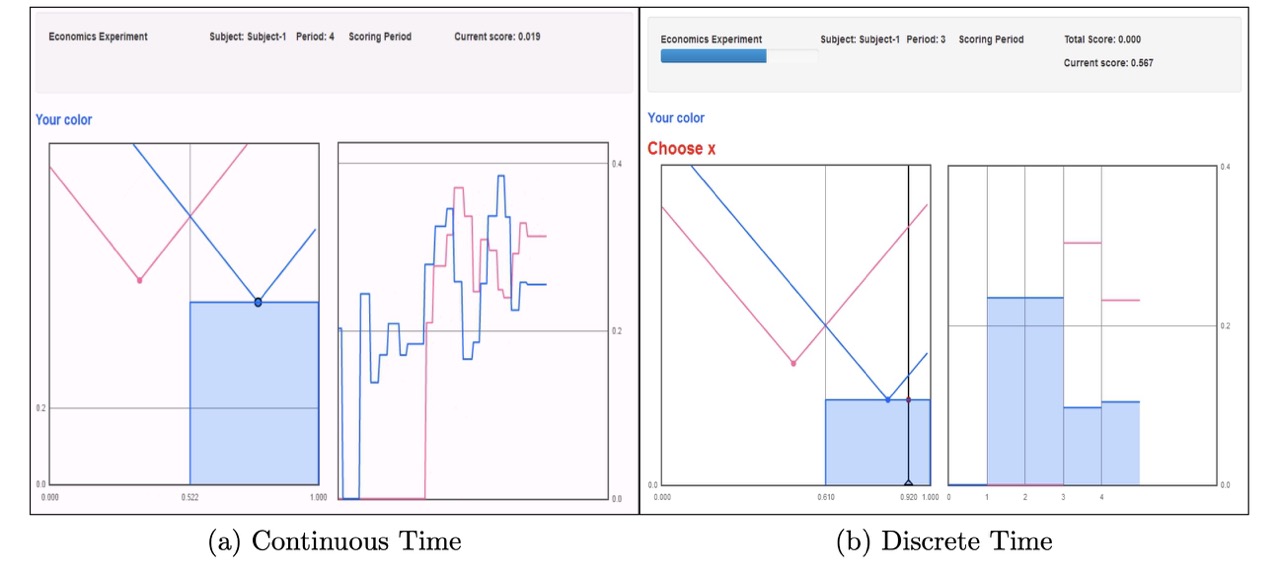
Figure 3: User Interfaces for the continuous and discrete treatments.

Written with Ciril Bosch-Rosa and Liam Rose

Abstract: Using a continuous-time experimental setup, we study how well Hotelling’s principle of minimum differentiation holds in its original two-dimensional (price and location) setting. By having subjects choose their location on a two-dimensional plane, we observe that the principle of minimum differentiation largely holds. We also study how different adjustment rates affect price coordination and find that, contrary to recent literature, the ability to respond quickly does not always increase cooperation rates.
View the article


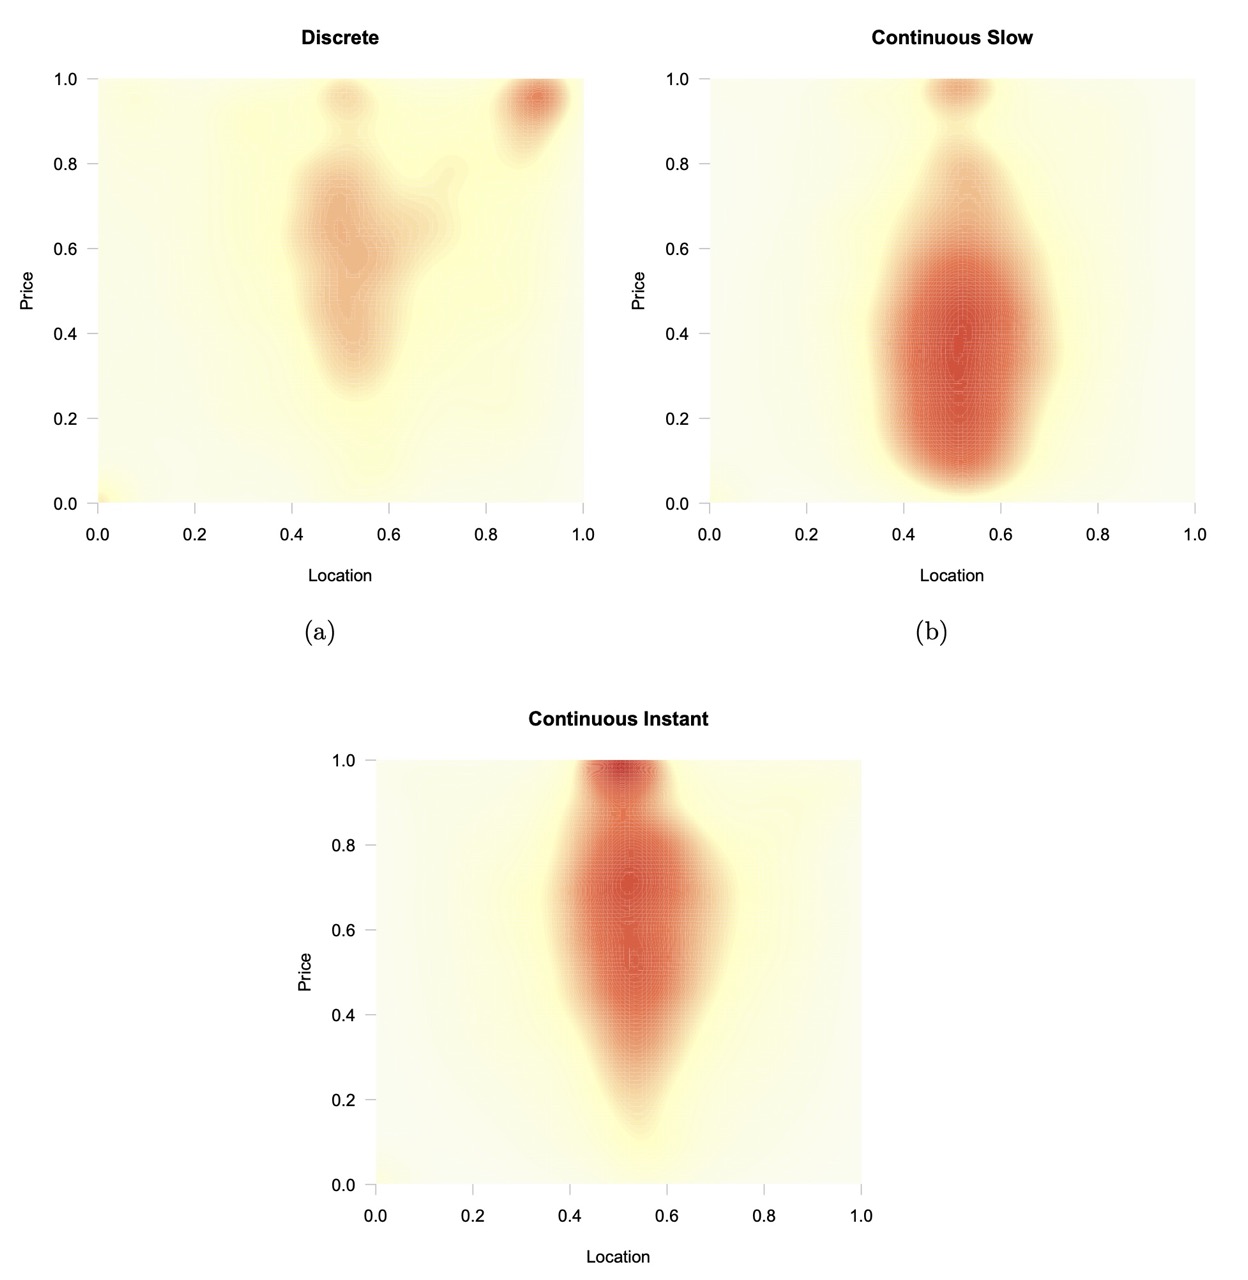
Figure 4: Heat Maps of Subject Price and Location Decisions by Treatment. The figure shows price and location decisions by treatment. The heat maps run from cool to hot colors, with “hotter” colors indicating that players spent more time in those positions.

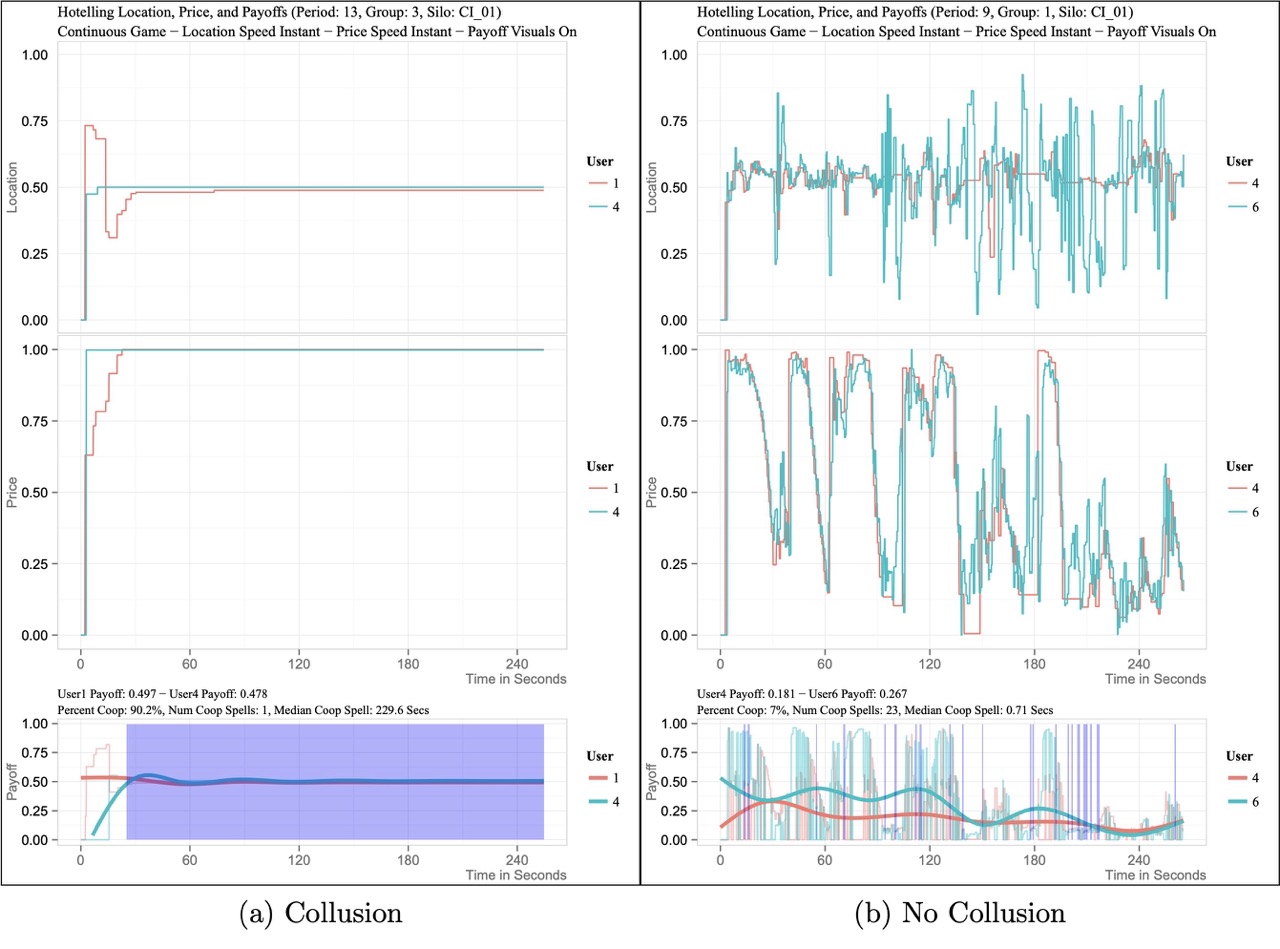
Figure 6: Two very different pairs. The left panel shows two subjects who successfully colluded for the majority of a period in the Continuous Time (CI) treatment. The top panel is the subject pairs’ location decisions over time, the middle panel is their price decisions over time, and the bottom panel is their flow payoff. Note that player 4 was an “aggressive colluder,” as she willingly took losses at the beginning of the period while waiting for her counterpart to conform. The right panel shows two subjects who were unable to collude in a period in the CI treatment. The top panel is the subject pairs’ location decisions over time, the middle panel is their price decisions over time, and the bottom panel is their flow payoff. Note that player 4 is the same subject shown in Figure 6a but with a more aggressive counterpart.

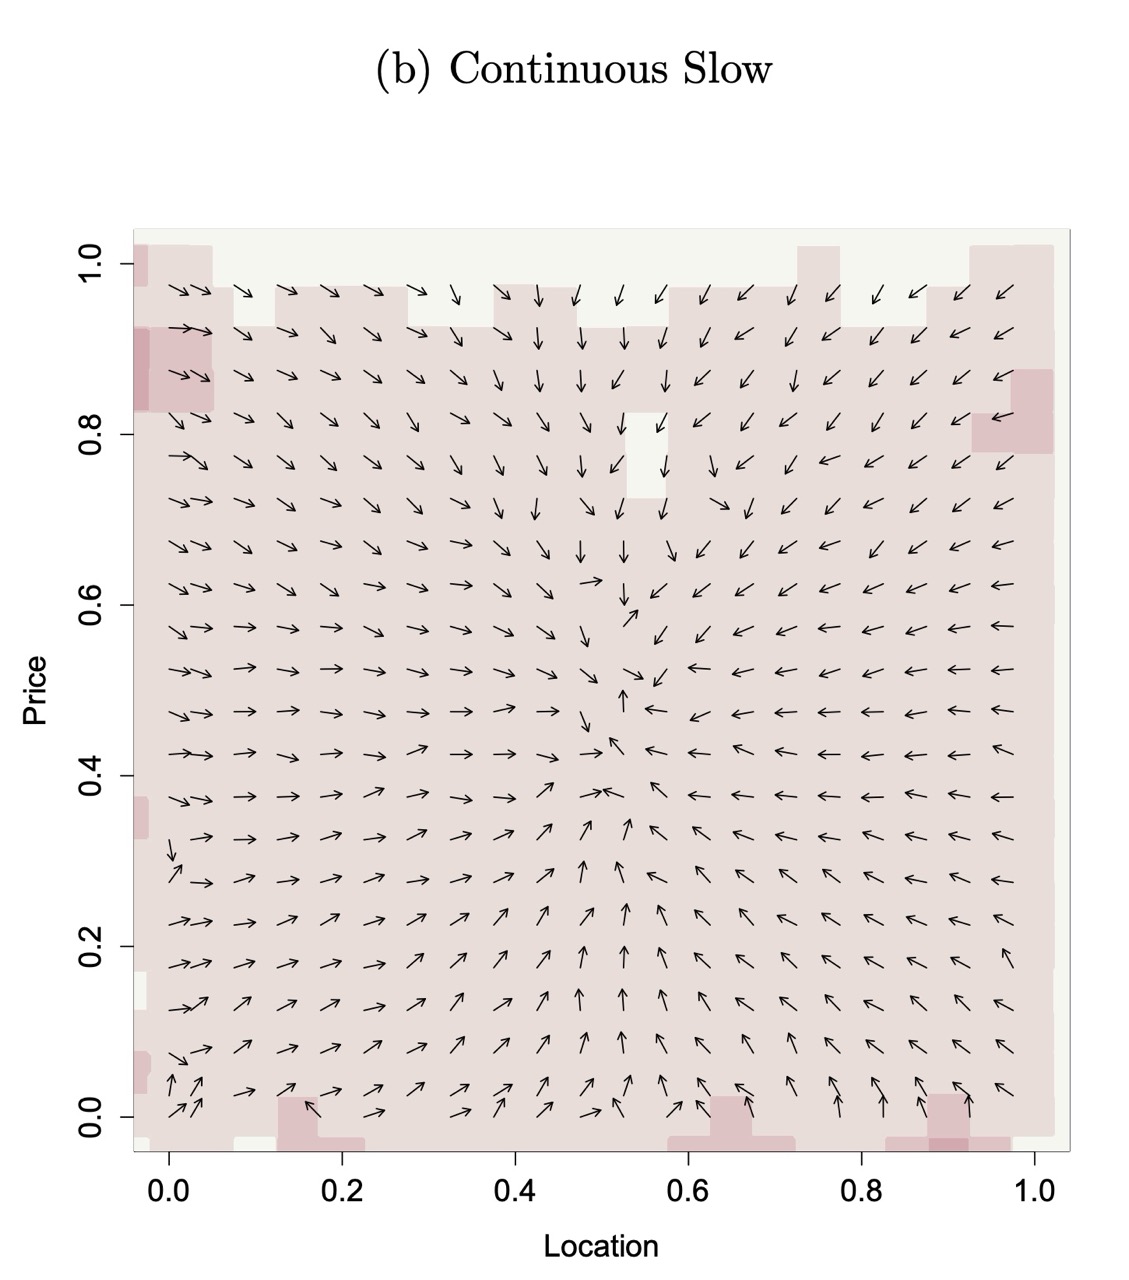
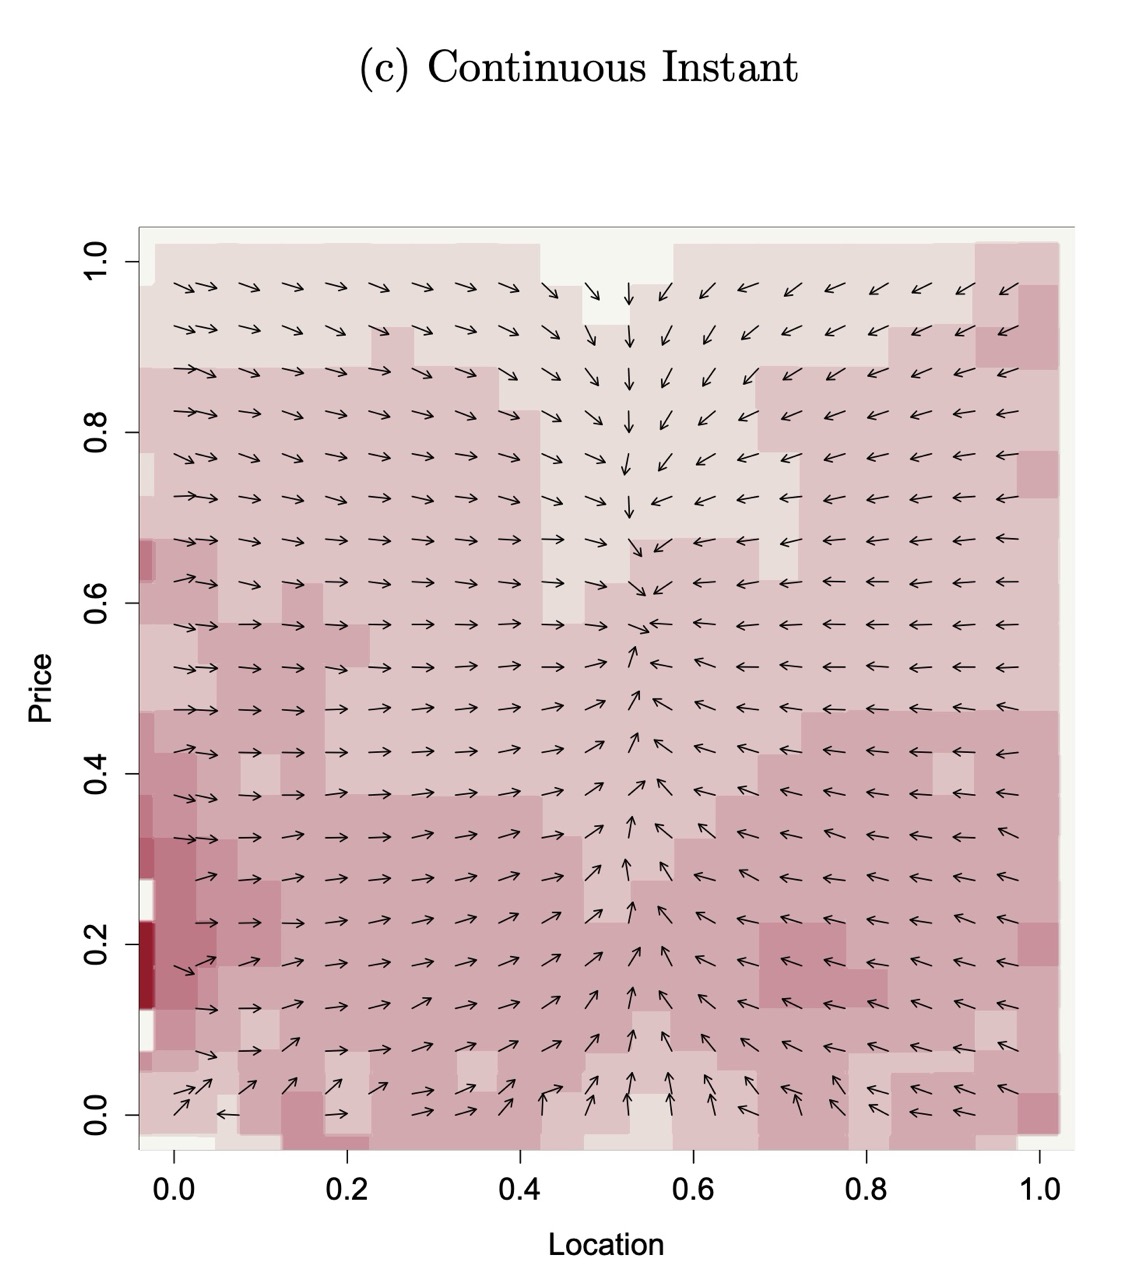
Figure 8: Vector Fields of Subject Position Adjustments by Treatment
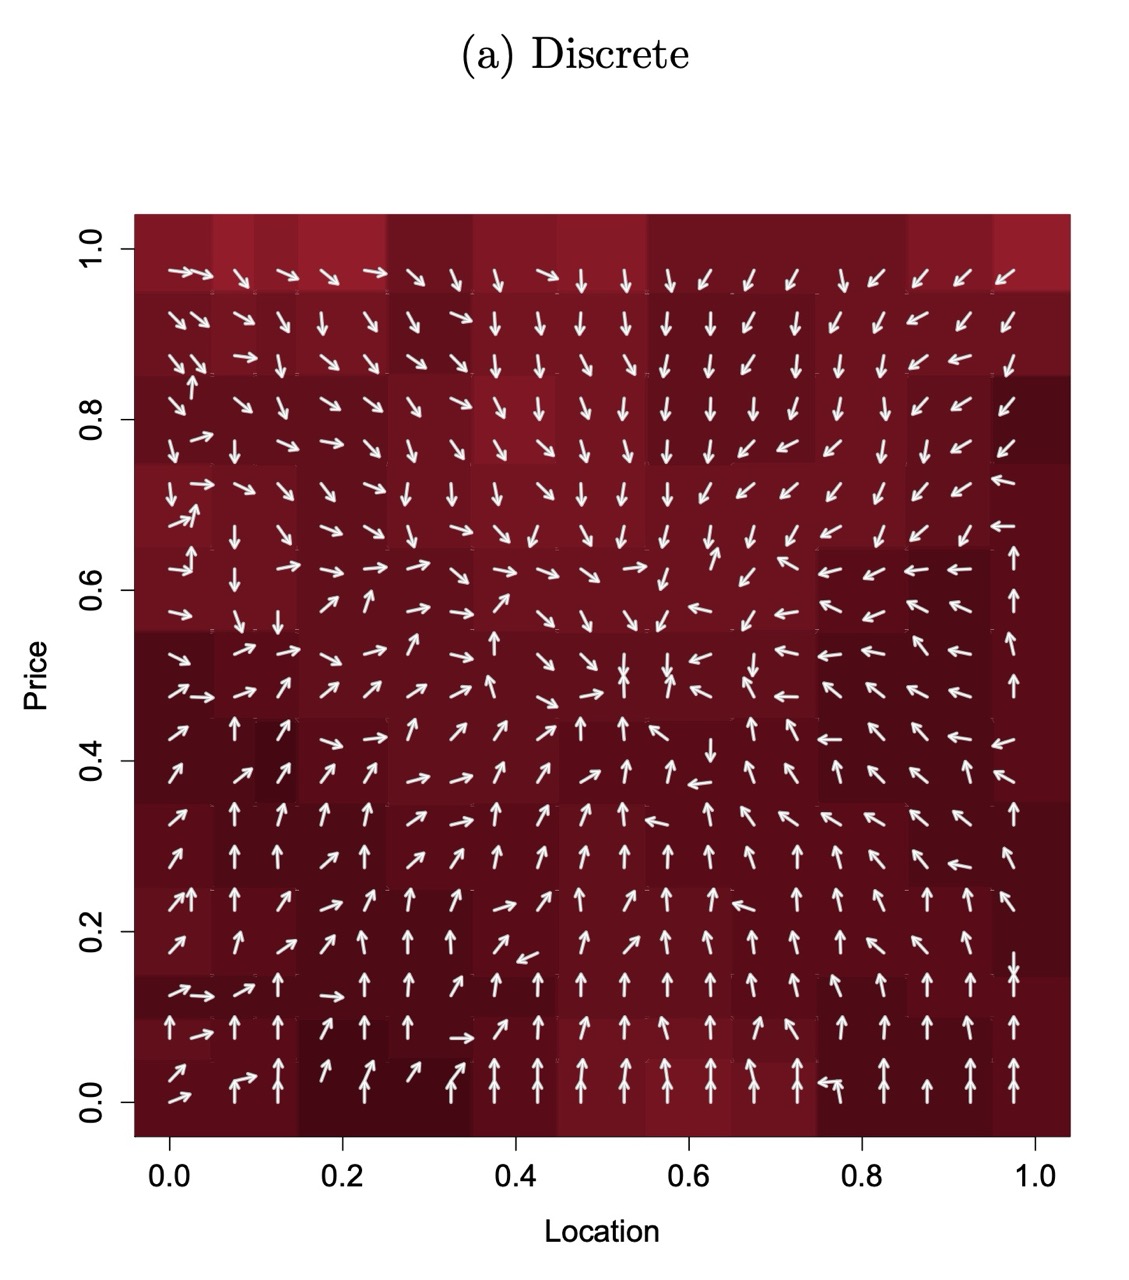
Notes: These figures show all players’ price and location decisions by treatment. Arrows indicate the average direction of action set changes starting from the arrow’s neighborhood. The heat maps run from cool to hot colors, with “hotter” colors indicating that players were more likely to change their action set while in that neighborhood.