library(dplyr)
library(tidyr)
library(readr)
library(stringr)
library(purrr)
library(ggplot2)
library(mgcv)

knitr::opts_chunk$set(autodep = TRUE, warning = FALSE, message = FALSE,
                      dev = "ragg_png")
knitr::dep_auto()

# Where the data is. This notebook renders in two repos, with two different
# working directories, and the same layout underneath either way:
#
#   Lexis repo    cwd is the project root (execute-dir: project)   -> "."
#   website repo  cwd is this page's own folder, and the ~5 MB it
#                 reads is committed one level up, shared with the
#                 sibling notebook page                            -> "../data"
#
# Probed rather than hardcoded, because getting it wrong fails deep inside a
# reader with a path that looks plausible.
ROOT <- Find(\(p) dir.exists(file.path(p, "out")), c(".", "data", "../data"))
if (is.null(ROOT)) stop(
  "cannot find the data directory.\n",
  "  Working directory is: ", getwd(), "\n",
  "  Looked for out/ under '.', 'data' and '../data'.\n",
  "  In the website repo, refresh the committed snapshot from the\n",
  "  USA-mortality-Lexis-Diagram repo:  python3 export_notebook_data.py",
  call. = FALSE)
# Writing back is a Lexis-repo job: those files feed the interactive build. In
# the website copy the data directory is a committed snapshot, so leave it be.
WRITE_BACK <- identical(ROOT, ".")
# The per-year cause files are plain CSV in the Lexis repo and gzipped in the
# website snapshot, where 26 MB becomes 3. readr opens either transparently, so
# this only has to pick the name that is actually on disk.
cause_file <- function(year) {
  p <- file.path(CAUSE_DIR, sprintf("deaths_by_cause_%d.csv", year))
  if (file.exists(p)) p else paste0(p, ".gz")
}
CAUSE_DIR <- file.path(ROOT, "out/causes")
HMD_DIR   <- file.path(ROOT, "raw-data/hmd-mortality-data")

# Plotted window. Ages stop at 90 because cause-specific counts at the very top
# of the age range are thin once they are split by cause.
AGE_PLOT <- c(0, 90)
PANEL <- "#EDF1F6"; INK <- "#1B3A6B"US mortality by cause of death, on the Lexis plot
Project
Data Visualization
Notebook producing Lexis plots of cause-of-death mortality. Based on NCHS Multiple Cause-of-Death files, 1959 to 2024.
Part of a century of American mortality in one data visualization. Play with the numbers in the interactive version, or read the companion notebooks on all causes.
What this does
Notebooks 01 to 03 use all-cause mortality from the Human Mortality Database, which has no cause of death in it. This one adds cause by going to the death certificates themselves: the NCHS Multiple Cause-of-Death files, 1959 to 2024.
Every plot here is the same Lexis plot used elsewhere in the project. Calendar year runs along the bottom, single year of age up the side, and one cell is one age in one year. Each cause gets three views:
- Death rate, the level. Deaths of that cause per 100,000 people of that age, on a log scale.
- Change in mortality, raw, the year-on-year change in that rate, with no model.
- Change in mortality, smoothed, the same change taken from a fitted surface.
Numerators come from the death certificates. Denominators are HMD exposure-to-risk, the same population figures the other notebooks use, because the cause files carry no population.
Where the data comes from
One source, for the whole span: the NBER mirror of the NCHS Multiple Cause-of-Death files, 1959 to 2024.
The data itself is collected and published by NCHS, the National Center for Health Statistics, the CDC agency that runs the US vital statistics system. Every death registered in the United States produces a certificate, and NCHS compiles them into one public-use record per death, carrying age, sex, year and the ICD code for the underlying cause. NBER republishes those files in a considerably more usable form, and the reason that matters is worth setting out, because it is most of the work.
Why NBER
NCHS distributes the Multiple Cause-of-Death files as fixed-width ASCII: one line per death certificate, no column names, no delimiters, every field identified purely by its character positions. A single year is two to three million lines and around 700MB uncompressed. To read one you need the record layout for that specific year, which NCHS publishes separately as a PDF codebook. So the work is not parsing a PDF, it is reading the PDF to learn which character positions hold which fields, then writing a parser against those positions.
The difficulty is that the layout changes. Record width in these files is 286 characters in 1968, 441 from the late 1970s, 489 in 2003 and 819 by 2024, and fields move between revisions. Each era needs its own field map, checked against its own codebook. Worse, the codebook PDFs are only readily available for recent years; the older layouts are correspondingly harder to pin down.
The National Bureau of Economic Research has done that work for every year from 1959 to 2024 and published the result: one CSV per year with named columns, alongside Stata dictionaries, SAS and SPSS read-in code. Sixty-six years of year-specific fixed-width parsing, already done, verified, and made available freely. This notebook would have been a substantially larger and more error-prone undertaking without it. Thank you NBER researchers!
National Bureau of Economic Research. Mortality Data: Vital Statistics NCHS Multiple Cause of Death Data. https://www.nber.org/research/data/mortality-data-vital-statistics-nchs-multiple-cause-death-data
One wrinkle, an annoying detour that helped validate teh NBER mirror. NBER serves the span under two different paths. 1959 to 2018 sit one directory per year under data.nber.org/mortality/, while 2019 onward live together under data.nber.org/nvss/mortality/csv/ with different filenames.
I later found the rest, and every year after 2018 now pulls from NBER. Before deleting the hand-written parser I compared the two extractions cell by cell across all six overlapping years: 2019 to 2024, 24 causes, both sexes, every single year of age. 29,084 cells, and not one of them differs. One method counts character positions against a published record layout, the other reads named columns from someone else’s parse, and they agree to the individual death everywhere they overlap. That is about as good as validation gets for both sides.
My processing
A script (04-by-cause/aggregate_causes.py) walks each year’s file one row at a time, keeps deaths of US residents, reads sex, age and the underlying cause code, maps that code to the cause groups used here, and tallies. The output is one small tidy table, per year, holding deaths by year, sex, single year of age and cause.
Every one of the sixty-six years goes through that same code path, which is only possible because NBER’s files carry named columns for the whole span. Nothing here depends on a character position.
The cause groupings, the ICD crosswalk described below, and the checks against published national totals. All that happens in my script.
The aggregated data - The per-year outputs are cause counts by year, sex and single year of age, 1959-2024. If that is useful to you, take it, with the caution above and the caution below firmly attached.
(TODO, link to that .py script and the aggregated CSVs… Download link to follow. )
Cause of death labels change
One of many words of caution with this dataset, the labeled cause of death is not always one thing across sixty-six years of mortality statistics.
Every death certificate carries one underlying cause, coded to the International Classification of Diseases. ICD is revised every ten to twenty years and the codes are renumbered each time. Four revisions are in force over this span: ICD-7 from 1959, ICD-8 from 1968, ICD-9 from 1979, ICD-10 from 1999.
So a cause is not one code you can filter on. It is a different code, inside a differently drawn group, in each era.
Broad groups travel better than narrow ones. “All cancers” means nearly the same thing in 1960 and 2020. “Chronic lower respiratory disease” might not.
Some causes don’t start in 1959. Drug poisoning and firearms need sub-codes that ICD-7 and ICD-8 do not carve out. HIV had no code until 1987. COVID-19 arrived in 2020. Each cause therefore carries its own first year, set out in the table below and enforced in the data rather than left to the reader.
The revision boundaries are visible. A jump at 1968, 1979 or 1999 in a cause-specific series is often the classification changing, not mortality. The boundaries are drawn on every plot as vertical guides so they are never mistaken for events.
Some Jargon
A crosswalk is just a lookup table: for each cause shown here, the list of ICD codes that belong to it under each of the four revisions. “Stroke” is codes 330-334 in ICD-7, 430-438 in ICD-8 and ICD-9, and I60-I69 in ICD-10. Ask for stroke deaths in 1965 and the code looks up the ICD-7 list; ask for 2015 and it uses the ICD-10 list. Without that table you would be filtering on a number that means something different in each era.
Validation & Debugging, checking the crosswalk against figures NCHS itself published at the time. If my code says 27,236 suicides in 1979 and the published figure is 27,206, quite close, then the mapping for that cause in that revision is almost certainly right. If it comes out 40% short, it probably is not.
I did this for each mortality cause, and found several bugs. The two worst produced a convincing-looking cliff at a revision boundary, but were my mistakes:
- Cardiovascular disease was missing ICD-7 codes 330-334. ICD-7 files stroke outside the circulatory chapter while ICD-8, 9 and 10 all put it inside, so the naive grouping gave a 42.7% share of all deaths in 1959 against 53.9% in 1968. That eleven-point step is exactly the stroke share. Corrected, 1959 reads 54.2%.
- Firearms was missing ICD-10 codes X93-X95, firearm assault, which is the largest single component. The series dropped 41.6% at 1999 and looked like a change of data source. It was a gap in my lookup table.
The full crosswalk, and the published figures each cause was checked against, are in 04-by-cause/aggregate_causes.py.
Cautions - Use this with lots of caution
A few things are worth keeping in mind. The first is the one everything else rests on: as you read these numbers, be aware that they are a count of registered death certificates, not of deaths. Almost always those are the same thing, which is why the distinction is easy to forget, and then occasionally they are not. The clearest illustration I found is the two Space Shuttle disasters. Neither crew appears anywhere in sixty-six years of these files: there is no spacecraft code at all in 1986, none in 2003, and the four spacecraft-coded deaths in the whole ICD-9 era fall in 1983, 1984, 1989 and 1995. Thirteen of the fourteen astronauts were US residents, so the exclusion of foreign residents does not explain it. Fourteen deaths out of roughly 180 million change nothing statistically, but they are a useful reminder that a death reaches this dataset by way of a state vital-registration office, and an event handled outside that ordinary flow can simply not arrive.
How causes are recorded changes over time. A death certificate reflects what could be diagnosed and what doctors were in the habit of writing down. Dementia is the clearest case: it is codeable well before 1999, but was rarely given as the underlying cause, so the early series might measure certification practice rather than disease. Several other causes shift more gently for the same reason, without ever producing a step obvious enough to see.
Coverage and methods change. 1972 is a 50% sample rather than a full count, and is weighted back up here. Registration completeness improves over the period.
Cause-specific counts get thin. All-cause mortality has enough deaths in every age-year cell to be stable. Split by cause, many cells hold a handful of deaths or none at all, especially for narrow causes at young ages (e.g. Diabetes, liver disease, Lung cancer, Colorectal cancer, not to mention Dementia & Alzheimer’s).
Those cells swing wildly in the change views, or drop out of the rate view entirely, and the movement is mostly arithmetic rather than epidemiology-interesting. The smoothed view is the more reliable one wherever a cause is sparse.
I would suggest a lot of caution in simply looking at these plots and interpreting too much from them. I’m worried that there may be some interesting-looking trends, many of which could turn out to be bureaucratic, statistical, or methodological artifacts.
But not every step is an artefact. Example, motor vehicle deaths fall 16% between 1973 and 1974, from 55,483 to 46,383, which looks exactly like the kind of seam the two problems above produced. But it is real: the national 55 mph speed limit took effect in January 1974, in the middle of the oil crisis that probably reduced driving, and it is one of the largest single-year drops in US traffic deaths on record. It also sits nowhere near a revision boundary, which is the first thing to check. The published figures show the same fall.
Who made this, and how much to trust it - This was assembled by an economist data scientist in his spare time over a few weekends, working with an AI chatbot and coding agents. Every figure quoted here was checked against something published, and several real bugs were caught that way, but the checking was not systematic or independent.
I would trust the underlying inputs a great deal more than I trust my handling of them. Field extraction across all sixty-six years is NBER’s, which is careful, long-established work. What is mine is everything after that: the cause groupings, the ICD crosswalk, the aggregation, and the plots.
There are certainly bugs and mistakes in here. Several were uncovered and fixed while writing it, and they had mostly looked convincing beforehand, and it would be strange if those were the only issues. If you find someting, please get in touch (ideally with a suggestion of how to fix it, or a PR).
TL:DR For entertainment purposes only. Please do not use these numbers for anything that matters.
Death Cause Notes
# The years each cause is trustworthy over, and why. This table is the notebook's
# main reusable output: it is written to out/causes/cause_windows.csv so the
# interactive version can force the same window when a cause is selected, rather
# than plotting a series across a boundary where the code meant something else.
cause_windows <- tribble(
  ~cause,                        ~from, ~to,   ~what, ~note,
  "All causes",                   1959, 2024,
    "Every death, whatever the cause.",
    "No crosswalk needed: every death is counted whatever its code.",
  "Cancer",                       1959, 2024,
    "All malignant tumours, any site.",
    "A whole ICD chapter. Broad groups like this carry across the 1968, 1979 and 1999 revisions with little change.",
  "Lung cancer",                  1959, 2024,
    "Cancer of the trachea, bronchus and lung.",
    "A single anatomical site. Site definitions changed little across the revisions.",
  "Colorectal cancer",            1959, 2024,
    "Cancer of the colon, rectum and anus.",
    "A single anatomical site. Site definitions changed little across the revisions.",
  "Cardiovascular",               1959, 2024,
    "All diseases of the heart and blood vessels, including stroke.",
    "Under ICD-7 (1959-1967) stroke sits outside the circulatory chapter, so codes 330-334 are added back for those years. Without that, 1959-1967 is understated by about eleven points.",
  "Heart disease",                1959, 2024,
    "Heart conditions specifically: heart attack, heart failure, rheumatic and hypertensive heart disease.",
    "Crosswalk checked at the ICD-7 to ICD-8 boundary: this cause holds the same share of all deaths either side of 1968, to about a tenth of a point, so the mapping does not jump there.",
  "Stroke",                       1959, 2024,
    "Cerebrovascular disease: bleeding or clotting in the blood vessels of the brain.",
    "Crosswalk checked at the ICD-7 to ICD-8 boundary: this cause holds the same share of all deaths either side of 1968, to about a tenth of a point, so the mapping does not jump there.",
  "Diabetes",                     1959, 2024,
    "Diabetes recorded as the condition that started the chain of events leading to death.",
    "A single ICD category that carries across all four revisions.",
  "Influenza & pneumonia",        1959, 2024,
    "Influenza and pneumonia together.",
    "The two components are also available separately.",
  "Influenza only",               1959, 2024,
    "Influenza alone, with pneumonia excluded.",
    "The influenza and pneumonia codes are separable in every revision, but the line between them depends on what the certifier wrote.",
  "Pneumonia only",               1959, 2024,
    "Pneumonia alone, with influenza excluded.",
    "The influenza and pneumonia codes are separable in every revision, but the line between them depends on what the certifier wrote.",
  "Alcoholic liver disease",      1959, 2024,
    "Cirrhosis and other liver damage attributed to alcohol.",
    "A single ICD category, stable across the revisions.",
  "External causes",              1959, 2024,
    "Everything that is not disease: accidents, suicide, homicide, poisoning, drowning, falls. The parent group for the six that follow.",
    "ICD-7 (1959-1967) numbers the external-cause blocks differently from later revisions. Handled in the crosswalk and checked against published 1959 counts.",
  "Motor vehicle",                1959, 2024,
    "Deaths in road traffic crashes, including drivers, passengers, pedestrians and cyclists.",
    "Checked against published national counts for 1959 and 1979.",
  "Suicide",                      1959, 2024,
    "Intentional self-harm, by any method.",
    "Checked against published national counts for 1959, 1968 and 1979.",
  "Homicide",                     1959, 2024,
    "Assault by another person, by any method.",
    "Checked against published counts; 1979 comes out about 2% low, most likely a definitional difference rather than a parsing error.",
  "Chronic lower respiratory",    1979, 2024,
    "Emphysema, chronic bronchitis, asthma and related long-term lung disease.",
    "Before ICD-9 (1979) the groupings for bronchitis, emphysema and asthma differ too much to compare: the share of all deaths steps 1.0% to 1.7% to 2.6% across the two earlier boundaries. The series therefore starts at 1979.",
  "Drug poisoning",               1979, 2024,
    "Overdose deaths of any intent: accidental, suicide, homicide or undetermined. Legal and illegal drugs alike.",
    "Needs sub-codes that only exist from ICD-9 (1979) onward, so the series starts there.",
  "Firearms",                     1979, 2024,
    "Deaths by gunshot of any intent, cutting across suicide, homicide and accident rather than sitting inside any one of them.",
    "Needs sub-codes that only exist from ICD-9 (1979) onward, so the series starts there.",
  "HIV/AIDS",                     1987, 2024,
    "Death from HIV infection and its complications.",
    "No ICD code existed for HIV before 1987, so the series starts there.",
  "Dementia & Alzheimer's",       1999, 2024,
    "Alzheimer's disease and other dementias.",
    "Codeable earlier, but rarely recorded as the underlying cause before ICD-10 (1999). An earlier series would measure certification practice, not disease.",
  "COVID-19",                     2020, 2024,
    "Death from COVID-19.",
    "Code U07.1, introduced in 2020.",
  "Deaths of despair",            1979, 2024,
    "Drug poisoning, suicide and alcoholic liver disease taken together. Each death counted once, so an overdose suicide is not double counted.",
    "Starts at 1979, the first year drug poisoning is available. The other two members reach back to 1959.",
  "Cancer + cardiovascular",      1959, 2024,
    "The two largest disease groups together, over half of all deaths in every year here.",
    "Both members carry the full span, so the combination does too.",

  # ---- cancer sites ----
  "Pancreatic cancer",            1959, 2024,
    "Cancer of the pancreas.",
    "A single anatomical site, stable across the revisions.",
  "Breast cancer",                1959, 2024,
    "Cancer of the breast, both sexes.",
    "A single anatomical site, stable across the revisions.",
  "Prostate cancer",              1959, 2024,
    "Cancer of the prostate.",
    "A single anatomical site, stable across the revisions.",
  "Liver cancer",                 1979, 2024,
    "Cancer of the liver and intrahepatic bile ducts.",
    "Starts at 1979. ICD-7 groups the liver with the biliary passages, and the share of all deaths doubles at the 1979 boundary, so the earlier years are not comparable.",
  "Brain cancer",                 1979, 2024,
    "Cancer of the brain.",
    "Starts at 1979. The ICD-7 category covers the rest of the nervous system as well as the brain.",
  "Bladder cancer",               1959, 2024,
    "Cancer of the bladder.",
    "A single anatomical site, stable across the revisions.",
  "Oesophageal cancer",           1959, 2024,
    "Cancer of the oesophagus.",
    "A single anatomical site, stable across the revisions.",
  "Leukemia",                     1959, 2024,
    "Leukemia, all types.",
    "The leukemia categories are separable in every revision.",
  "Lymphoma",                     1959, 2024,
    "Hodgkin and non-Hodgkin lymphoma.",
    "The lymphoma categories are separable in every revision.",
  "Cancer, site unspecified",     1999, 2024,
    "Cancer certified without a named primary site.",
    "Starts at 1999. This records how deaths were certified rather than a disease, and its size moves at every revision boundary.",

  # ---- respiratory ----
  "Respiratory",                  1959, 2024,
    "All diseases of the respiratory system.",
    "A whole ICD chapter. In ICD-7 (1959-1967) asthma is filed outside the respiratory chapter and is added back here, so the chapter means the same thing in every year.",
  "Asthma",                       1979, 2024,
    "Asthma, including fatal asthma attacks.",
    "Starts at 1979. The share of all deaths falls 38% at the 1968 boundary and rises 40% at 1979, so the earlier years are not comparable.",
  "Interstitial lung disease",    1999, 2024,
    "Scarring and inflammation of the lung tissue itself.",
    "Starts at 1999. There is no stable equivalent of the ICD-10 category in the earlier revisions.",
  "Aspiration pneumonitis",       1979, 2024,
    "Lung injury from inhaling food, liquid or vomit.",
    "Starts at 1979. ICD-7 and ICD-8 have no counterpart category.",

  # ---- nervous system and mental ----
  "Nervous system",               1959, 2024,
    "All diseases of the brain, spinal cord and nerves.",
    "The chapter share rises 43% at the 1999 boundary, as the ICD-10 category for degenerative brain disease came into wide use as an underlying cause. Read the step at 1999 as certification practice rather than mortality. The series is not cut short there because the chapters have to sum to all deaths in every year.",
  "Parkinson's disease",          1959, 2024,
    "Parkinson's disease.",
    "A single category present in all four revisions, with the share of all deaths steady across each boundary.",
  "Other degenerative brain disease", 1999, 2024,
    "Degenerative brain disease other than Alzheimer's, including Lewy body and frontotemporal dementia.",
    "Starts at 1999. The category is defined against the separate Alzheimer's code, which only exists from ICD-10.",
  "Mental & behavioural",         1959, 2024,
    "Mental and behavioural disorders, including the dementia codes that sit outside the nervous system chapter, and the alcohol and drug use disorders.",
    "A whole ICD chapter. Most of it is dementia, which is also available on its own as a cause spanning this chapter and the nervous system one.",

  # ---- remaining chapters ----
  "Endocrine & metabolic",        1959, 2024,
    "Hormonal, nutritional and metabolic disorders.",
    "A whole ICD chapter. In ICD-7 (1959-1967) asthma sits in this chapter and is counted under respiratory instead.",
  "Digestive",                    1959, 2024,
    "All diseases of the digestive system.",
    "A whole ICD chapter, stable across the revisions.",
  "Genitourinary",                1959, 2024,
    "All diseases of the kidneys, urinary tract and reproductive organs.",
    "A whole ICD chapter, stable across the revisions.",
  "Chronic kidney disease",       1999, 2024,
    "Long-term loss of kidney function.",
    "Starts at 1999. The ICD-9 category for chronic renal failure is much narrower, and the share of all deaths rises 153% at that boundary.",
  "Infectious",                   1959, 2024,
    "Infectious and parasitic diseases.",
    "A whole ICD chapter, stable across the revisions.",
  "Sepsis",                       1968, 2024,
    "Bloodstream infection and the body's response to it.",
    "Starts at 1968; ICD-7 has no counterpart category. The share of all deaths also rises 26% at the 1999 boundary.",
  "Ill-defined",                  1959, 2024,
    "Symptoms, signs and conditions where the certificate names no specific disease.",
    "A whole ICD chapter, stable across the revisions.",
  "All other causes",             1959, 2024,
    "Every death in none of the chapters above: musculoskeletal, blood and immune, skin, congenital, perinatal and pregnancy conditions, benign tumours, and codes that will not parse.",
    "Computed as a residual from the full code definitions in every year, so no series beginning later adds a step to it."
)

if (WRITE_BACK) write_csv(cause_windows, file.path(CAUSE_DIR, "cause_windows.csv"))
# The "what" column repeats under each plot, so the summary table keeps to the
# windows and the reason for them.
knitr::kable(cause_windows |> select(cause, from, to, note))| cause | from | to | note |
|---|---|---|---|
| All causes | 1959 | 2024 | No crosswalk needed: every death is counted whatever its code. |
| Cancer | 1959 | 2024 | A whole ICD chapter. Broad groups like this carry across the 1968, 1979 and 1999 revisions with little change. |
| Lung cancer | 1959 | 2024 | A single anatomical site. Site definitions changed little across the revisions. |
| Colorectal cancer | 1959 | 2024 | A single anatomical site. Site definitions changed little across the revisions. |
| Cardiovascular | 1959 | 2024 | Under ICD-7 (1959-1967) stroke sits outside the circulatory chapter, so codes 330-334 are added back for those years. Without that, 1959-1967 is understated by about eleven points. |
| Heart disease | 1959 | 2024 | Crosswalk checked at the ICD-7 to ICD-8 boundary: this cause holds the same share of all deaths either side of 1968, to about a tenth of a point, so the mapping does not jump there. |
| Stroke | 1959 | 2024 | Crosswalk checked at the ICD-7 to ICD-8 boundary: this cause holds the same share of all deaths either side of 1968, to about a tenth of a point, so the mapping does not jump there. |
| Diabetes | 1959 | 2024 | A single ICD category that carries across all four revisions. |
| Influenza & pneumonia | 1959 | 2024 | The two components are also available separately. |
| Influenza only | 1959 | 2024 | The influenza and pneumonia codes are separable in every revision, but the line between them depends on what the certifier wrote. |
| Pneumonia only | 1959 | 2024 | The influenza and pneumonia codes are separable in every revision, but the line between them depends on what the certifier wrote. |
| Alcoholic liver disease | 1959 | 2024 | A single ICD category, stable across the revisions. |
| External causes | 1959 | 2024 | ICD-7 (1959-1967) numbers the external-cause blocks differently from later revisions. Handled in the crosswalk and checked against published 1959 counts. |
| Motor vehicle | 1959 | 2024 | Checked against published national counts for 1959 and 1979. |
| Suicide | 1959 | 2024 | Checked against published national counts for 1959, 1968 and 1979. |
| Homicide | 1959 | 2024 | Checked against published counts; 1979 comes out about 2% low, most likely a definitional difference rather than a parsing error. |
| Chronic lower respiratory | 1979 | 2024 | Before ICD-9 (1979) the groupings for bronchitis, emphysema and asthma differ too much to compare: the share of all deaths steps 1.0% to 1.7% to 2.6% across the two earlier boundaries. The series therefore starts at 1979. |
| Drug poisoning | 1979 | 2024 | Needs sub-codes that only exist from ICD-9 (1979) onward, so the series starts there. |
| Firearms | 1979 | 2024 | Needs sub-codes that only exist from ICD-9 (1979) onward, so the series starts there. |
| HIV/AIDS | 1987 | 2024 | No ICD code existed for HIV before 1987, so the series starts there. |
| Dementia & Alzheimer’s | 1999 | 2024 | Codeable earlier, but rarely recorded as the underlying cause before ICD-10 (1999). An earlier series would measure certification practice, not disease. |
| COVID-19 | 2020 | 2024 | Code U07.1, introduced in 2020. |
| Deaths of despair | 1979 | 2024 | Starts at 1979, the first year drug poisoning is available. The other two members reach back to 1959. |
| Cancer + cardiovascular | 1959 | 2024 | Both members carry the full span, so the combination does too. |
| Pancreatic cancer | 1959 | 2024 | A single anatomical site, stable across the revisions. |
| Breast cancer | 1959 | 2024 | A single anatomical site, stable across the revisions. |
| Prostate cancer | 1959 | 2024 | A single anatomical site, stable across the revisions. |
| Liver cancer | 1979 | 2024 | Starts at 1979. ICD-7 groups the liver with the biliary passages, and the share of all deaths doubles at the 1979 boundary, so the earlier years are not comparable. |
| Brain cancer | 1979 | 2024 | Starts at 1979. The ICD-7 category covers the rest of the nervous system as well as the brain. |
| Bladder cancer | 1959 | 2024 | A single anatomical site, stable across the revisions. |
| Oesophageal cancer | 1959 | 2024 | A single anatomical site, stable across the revisions. |
| Leukemia | 1959 | 2024 | The leukemia categories are separable in every revision. |
| Lymphoma | 1959 | 2024 | The lymphoma categories are separable in every revision. |
| Cancer, site unspecified | 1999 | 2024 | Starts at 1999. This records how deaths were certified rather than a disease, and its size moves at every revision boundary. |
| Respiratory | 1959 | 2024 | A whole ICD chapter. In ICD-7 (1959-1967) asthma is filed outside the respiratory chapter and is added back here, so the chapter means the same thing in every year. |
| Asthma | 1979 | 2024 | Starts at 1979. The share of all deaths falls 38% at the 1968 boundary and rises 40% at 1979, so the earlier years are not comparable. |
| Interstitial lung disease | 1999 | 2024 | Starts at 1999. There is no stable equivalent of the ICD-10 category in the earlier revisions. |
| Aspiration pneumonitis | 1979 | 2024 | Starts at 1979. ICD-7 and ICD-8 have no counterpart category. |
| Nervous system | 1959 | 2024 | The chapter share rises 43% at the 1999 boundary, as the ICD-10 category for degenerative brain disease came into wide use as an underlying cause. Read the step at 1999 as certification practice rather than mortality. The series is not cut short there because the chapters have to sum to all deaths in every year. |
| Parkinson’s disease | 1959 | 2024 | A single category present in all four revisions, with the share of all deaths steady across each boundary. |
| Other degenerative brain disease | 1999 | 2024 | Starts at 1999. The category is defined against the separate Alzheimer’s code, which only exists from ICD-10. |
| Mental & behavioural | 1959 | 2024 | A whole ICD chapter. Most of it is dementia, which is also available on its own as a cause spanning this chapter and the nervous system one. |
| Endocrine & metabolic | 1959 | 2024 | A whole ICD chapter. In ICD-7 (1959-1967) asthma sits in this chapter and is counted under respiratory instead. |
| Digestive | 1959 | 2024 | A whole ICD chapter, stable across the revisions. |
| Genitourinary | 1959 | 2024 | A whole ICD chapter, stable across the revisions. |
| Chronic kidney disease | 1999 | 2024 | Starts at 1999. The ICD-9 category for chronic renal failure is much narrower, and the share of all deaths rises 153% at that boundary. |
| Infectious | 1959 | 2024 | A whole ICD chapter, stable across the revisions. |
| Sepsis | 1968 | 2024 | Starts at 1968; ICD-7 has no counterpart category. The share of all deaths also rises 26% at the 1999 boundary. |
| Ill-defined | 1959 | 2024 | A whole ICD chapter, stable across the revisions. |
| All other causes | 1959 | 2024 | Computed as a residual from the full code definitions in every year, so no series beginning later adds a step to it. |
# Extra prose for causes with turns worth pointing at. Keyed by cause name and
# emitted under that cause's plots only.
#
# These are dated against the series, not inferred from it. Everything here is a
# coincidence of timing: the data can show when a series turned, and can rule a
# date out when the turn came first, but it cannot attribute the turn to a law.
CAUSE_EXTRA <- list(
  "Motor vehicle" = paste(
"**Turns in this series, and what they line up with.** These are timing coincidences worth knowing, not explanations: nothing here can establish cause.",
"",
"- **1974, down 16%** (55,483 to 46,383), the largest single-year fall in the series. The national 55 mph speed limit took effect on 2 January 1974 under the Emergency Highway Energy Conservation Act. It arrived in the middle of the oil crisis, so less driving and slower driving happen in the same year and this data cannot separate them.",
"- **1981 to 1983, down 13%**, steepest in 1982 at -11.3%. This spans the 1981-82 recession. The Surface Transportation Assistance Act was signed in January 1983, after most of the fall had already happened.",
"- **1989 to 1992, down 16%, and concentrated in the young.** Deaths under 25 fall from 16,428 to 13,229, a 20% drop against 12% for everyone else. The federal minimum drinking age of 21 was enacted in 1984 and in force in every state by 1988, which fits a decline specific to young drivers. ISTEA passed in December 1991, near the end of this fall rather than at its start.",
"- **1984 is often given as a seatbelt milestone**, but there has never been a federal law requiring adults to wear seatbelts. New York's law, effective 1 December 1984, was the first state law of its kind and other states followed over the next three decades. Nothing visible happens here in 1984 or 1985; 1984 is up 4.1%.",

sep = "\n"),

  "Influenza only" = paste(
"**Influenza is spiky, pneumonia is not.** Over the years available, influenza runs from 257 deaths in its quietest year to 7,877 in its worst, a factor of 31. Pneumonia moves by a factor of 2 across the same span. Almost all of the year-to-year movement in the combined series is influenza; almost all of its level is pneumonia.",
"",
"**1968 is the largest single-year rise in the series**, 1,474 deaths to 7,059, up 379%. It coincides with the 1968-69 H3N2 pandemic, the so-called Hong Kong flu. Other sharp years include 1960, 1963, and the 2009 Swine Flu outbreak. In 2021, flu takes a curious break during the COVID-19 pandemic.",
"",
"**ICD Splits are visible in 1979 and 1999** - The line between influenza and pneumonia is drawn differently in each ICD revision, and the two boundaries are visible in the counts. Influenza falls from 4,051 in 1978 to 604 in 1979, which is ICD-9 narrowing influenza to a single code rather than a mild season. Pneumonia falls 31% at 1999 for the same kind of reason. Neither step is epidemiological. The combined series does not have this problem, which is why it is the one to use across long spans.",
sep = "\n")
)

# Pneumonia only carries the same note as Influenza only: the split, the
# spikiness and the revision-boundary caveat all apply to both halves.
CAUSE_EXTRA[["Pneumonia only"]] <- CAUSE_EXTRA[["Influenza only"]]

# Written out so the interactive page can show the same notes rather than a
# second copy that drifts. Same reason cause_windows.csv is written above.
if (WRITE_BACK) jsonlite::write_json(CAUSE_EXTRA, file.path(CAUSE_DIR, "cause_notes.json"),
                     auto_unbox = TRUE)
Load da data
# One CSV per year, already aggregated to (year, sex, age, cause).
cause_files <- list.files(CAUSE_DIR, pattern = "^deaths_by_cause_\\d{4}\\.csv(\\.gz)?$",
                          full.names = TRUE)
stopifnot(length(cause_files) > 0)

causes_raw <- map_dfr(cause_files, read_csv, col_types = cols(
  Year = col_integer(), Sex = col_character(), Age = col_integer(),
  Cause = col_character(), deaths = col_double(), icd_revision = col_character()))

# Sex is carried all the way through so male/female plots need no reprocessing.
# The plots below use the combined series; swap PLOT_SEX to "Male" or "Female"
# to rebuild the whole notebook for one sex.
PLOT_SEX <- "Total"

causes <- causes_raw |>
  bind_rows(causes_raw |>                      # add a Total by summing the sexes
              group_by(Year, Age, Cause, icd_revision) |>
              summarise(deaths = sum(deaths), .groups = "drop") |>
              mutate(Sex = "Total"))

# Denominators: HMD exposure-to-risk, the same population used everywhere else.
read_hmd_1x1 <- function(path, value_name) {
  read_table(path, skip = 2, na = ".", col_types = cols(
    Year = col_integer(), Age = col_character(),
    Female = col_double(), Male = col_double(), Total = col_double())) |>
    mutate(Age = as.integer(str_remove(Age, "\\+"))) |>
    pivot_longer(c(Female, Male, Total), names_to = "Sex", values_to = value_name)
}
exposures <- read_hmd_1x1(file.path(HMD_DIR, "Exposures_1x1.txt"), "exposure")

cat("years:", min(causes$Year), "-", max(causes$Year),
    " causes:", n_distinct(causes$Cause), "\n")
years: 1959 - 2024 causes: 63 # The aggregation writes one file per year and takes a while. Rendering against
# a partial run silently produces plots with holes in them, so say so plainly.
have <- sort(unique(causes$Year))
missing <- setdiff(seq(min(have), max(have)), have)
if (length(missing)) {
warning("missing years in out/causes: ", paste(missing, collapse = ", "),
". Re-run aggregate_causes.py before trusting these plots.",
call. = FALSE, immediate. = TRUE)
}# Deaths joined to population, giving a cause-specific death rate on the same
# Lexis grid as the rest of the project. Rates are per 100,000 rather than the
# per-1,000 used for all-cause mortality, because most single causes are rare
# enough that per-1,000 would run to three decimal places.
rates <- causes |>
inner_join(exposures, by = c("Year", "Age", "Sex")) |>
filter(exposure > 0, between(Age, AGE_PLOT[1], AGE_PLOT[2])) |>
mutate(mx = deaths / exposure, per_100k = 1e5 * mx)
# Clip each cause to the window it is trustworthy over.
rates <- rates |>
inner_join(cause_windows |> select(Cause = cause, from, to), by = "Cause") |>
filter(Year >= from, Year <= to)
# Per-cause coverage check. The year check above catches a year missing from
# every cause, but not a single cause that is short: adding a new cause to the
# crosswalk and rendering before the re-aggregation has finished gives a series
# that silently stops partway, which looks like a data limit rather than a
# half-finished job. Compare what each cause actually spans against what it
# claims to span.
coverage <- rates |>
summarise(have_from = min(Year), have_to = max(Year),
n_years = n_distinct(Year), .by = c(Cause, from, to)) |>
mutate(expected = to - from + 1) |>
filter(have_from > from | have_to < to | n_years < expected)
if (nrow(coverage)) {
warning("causes with incomplete coverage:\n",
paste0(" ", coverage$Cause, ": have ", coverage$have_from, "-",
coverage$have_to, " (", coverage$n_years, " years), ",
"declared ", coverage$from, "-", coverage$to,
collapse = "\n"),
"\nRe-run aggregate_causes.py to completion before trusting these.",
call. = FALSE, immediate. = TRUE)
}
# Any cause with no rows at all never reaches the loop below, so name it here.
absent <- setdiff(cause_windows$cause, unique(rates$Cause))
if (length(absent)) {
warning("causes declared but absent from the data: ",
paste(absent, collapse = ", "), call. = FALSE, immediate. = TRUE)
}Building the three views
# For one cause and sex: the observed rate, the raw annual change, and the
# smoothed annual change, on a single tidy grid.
#
# The smoother is the same one used in notebook 01: a two-dimensional P-spline
# fitted to death counts with log exposure as an offset, under a Poisson
# likelihood. Smoothing is applied to the death rates, not to the changes.
build_cause <- function(cause_name, sex = PLOT_SEX) {
  d <- rates |> filter(Cause == cause_name, Sex == sex) |> arrange(Age, Year)
  ny <- n_distinct(d$Year); na <- n_distinct(d$Age)
  # Three years is the floor: one is consumed by the year-on-year difference,
  # and a two-point series has nothing to smooth.
  if (nrow(d) < 200 || ny < 3) return(NULL)

  # Basis size: about one spline function per 5 calendar years, and one per
  # 2.5 years of age when the window includes childhood, where mortality falls
  # steeply between age 0 and 10 and a coarser basis smooths through it.
  #
  # Capped at one fewer than the number of distinct values, because a basis
  # cannot ask for more functions than the data has points to fit them. COVID-19
  # spans five years, so a flat floor of 6 made it unfittable and dropped the
  # cause from the notebook entirely.
  age_div <- if (min(d$Age) < 15) 2.5 else 5
  k_year <- min(max(4, round(ny / 5) + 3), ny - 1)
  k_age  <- min(max(6, round(na / age_div) + 3), na - 1)

  fit <- try(bam(deaths ~ te(Year, Age, bs = "ps", k = c(k_year, k_age)) +
                   offset(log(exposure)),
                 family = poisson(), data = d, method = "fREML", discrete = TRUE),
             silent = TRUE)
  if (inherits(fit, "try-error")) return(NULL)

  d |>
    mutate(log_mx_hat = as.numeric(predict(fit, type = "link")) - log(exposure)) |>
    group_by(Age) |>
    # Sign flipped so that positive, and therefore green, means the rate fell.
    #
    # The lag is only a one-year change if the previous row really is the
    # previous calendar year. Any hole in the year coverage would otherwise be
    # reported as a single enormous annual change spanning the gap, so the
    # comparison is dropped wherever the years are not adjacent.
    mutate(adjacent   = !is.na(lag(Year)) & lag(Year) == Year - 1,
           chg_raw    = if_else(adjacent, -100 * (log(mx) - lag(log(mx))), NA_real_),
           chg_smooth = if_else(adjacent, -100 * (log_mx_hat - lag(log_mx_hat)), NA_real_)) |>
    ungroup() |>
    mutate(cohort = Year - Age)
}
# Diverging ramp for the change views, read off the published Economist legend:
# it fades gradually through dark blue on the worsening side but saturates to
# full bright green within about two points of zero.
CHG_VALUES <- c(-6, -3, -1.2, 0, 0.7, 1.8, 6)
CHG_COLORS <- c("#0B1B4A", "#2E3566", "#8C8FAE", "#F2F0EC",
"#B6E7D4", "#4BCCA5", "#4BCCA5")
# Sequential ramp for the rate views, matching the interactive version.
RATE_COLORS <- c("#26185A", "#224EA8", "#1E8EC8", "#2CBAA8",
"#7ED460", "#E9D536", "#F29228", "#B01822")
base_theme <- function() {
theme_minimal(11) +
theme(
plot.background = element_rect(fill = PANEL, color = NA),
panel.grid = element_blank(),
plot.title = element_text(face = "bold", size = 13, color = INK),
plot.subtitle = element_text(size = 10.5, color = INK),
plot.caption = element_text(size = 9, color = INK, hjust = 0),
axis.title = element_text(face = "bold", color = INK, size = 10),
axis.text = element_text(color = INK, size = 8.5),
legend.title = element_text(color = INK, size = 9, face = "bold"),
legend.text = element_text(color = INK, size = 8.5)
)
}
# ICD revision boundaries, drawn on every plot so a step at one of them is not
# read as an event.
ICD_BREAKS <- c(1968, 1979, 1999)
lexis_cause <- function(d, view = c("rate", "raw", "smooth"),
title = "", limit = NULL) {
view <- match.arg(view)
brks <- ICD_BREAKS[ICD_BREAKS > min(d$Year) & ICD_BREAKS <= max(d$Year)]
if (view == "rate") {
d <- d |> filter(per_100k > 0)
# Legend rescaled to this cause: rates span five orders of magnitude between
# a rare cause in childhood and a common one in old age, so one fixed scale
# across all causes would leave most plots a single color.
rng <- range(d$per_100k)
dec <- 10 ^ seq(floor(log10(rng[1])), ceiling(log10(rng[2])))
p <- ggplot(d, aes(Year, Age, fill = per_100k)) +
geom_raster() +
scale_fill_gradientn(colors = RATE_COLORS, transform = "log10",
limits = rng, breaks = dec,
labels = function(x) format(x, big.mark = ",",
scientific = FALSE, trim = TRUE),
name = "per 100,000") +
labs(subtitle = "Death rate, per 100,000 people per year, log scale")
} else {
v <- if (view == "raw") "chg_raw" else "chg_smooth"
d <- d |> filter(!is.na(.data[[v]]))
# Symmetric about zero so pale always means no change, with the larger side
# setting both ends. Clipped at the 99th percentile so one extreme cell
# cannot flatten the whole plot.
lim <- limit %||% max(1, quantile(abs(d[[v]]), 0.99, na.rm = TRUE))
p <- ggplot(d, aes(Year, Age, fill = .data[[v]])) +
geom_raster() +
scale_fill_gradientn(
colors = CHG_COLORS,
values = scales::rescale(CHG_VALUES, from = c(-6, 6)),
limits = c(-lim, lim), oob = scales::squish,
breaks = c(-lim, 0, lim),
labels = function(x) paste0(round(x, 1), "%"),
name = NULL) +
labs(subtitle = sprintf(
"Annual change in the death rate, %s. Green: rate fell. Blue: rate rose. Scale +/-%.1f%%",
if (view == "raw") "unsmoothed" else "smoothed", lim))
}
p +
geom_vline(xintercept = brks, color = "white", linewidth = 0.45, alpha = 0.8) +
geom_vline(xintercept = brks, color = INK, linewidth = 0.3, linetype = "22") +
scale_x_continuous(expand = c(0, 0)) +
scale_y_continuous(expand = c(0, 0)) +
# What the dashed lines mean is explained in markdown under the tabset
# rather than in a caption, so it reads as prose and is not repeated three
# times per cause.
labs(title = title, x = "Year", y = "Age") +
base_theme()
}
`%||%` <- function(a, b) if (is.null(a)) b else a# Returns one cause as a block of markdown: a level-3 heading, then a tabset
# holding the three views at level 4.
#
# The figures are generated with knit_child rather than printed straight from a
# results="asis" chunk. Printing works for text but not for plots: knitr routes
# plot output through a separate hook and flushes it at the end of the chunk, so
# every figure lands after all of the cat() output instead of inside its own tab.
# knit_child writes each figure as a real chunk in the right place.
VIEWS <- c(rate = "Death rate", raw = "Change, raw", smooth = "Change, smoothed")
cause_block <- function(cause_name) {
d <- build_cause(cause_name)
if (is.null(d)) {
return(paste0("\n### ", cause_name, "\n\n*No usable data for this cause.*\n\n"))
}
w <- cause_windows |> filter(cause == cause_name)
# Chunk labels have to be unique across the whole document.
slug <- gsub("(^-|-$)", "", gsub("[^a-z0-9]+", "-", tolower(cause_name)))
.cause <- cause_name
tabs <- vapply(names(VIEWS), function(v) {
.v <- v
knitr::knit_child(
text = c(
paste0("#### ", VIEWS[[v]]),
"",
paste0("```{r fig-", slug, "-", v,
", echo=FALSE, fig.width=9, fig.height=5.4}"),
"print(lexis_cause(d, .v, title = .cause))",
"```",
""),
envir = environment(), quiet = TRUE)
}, character(1))
# Notes under the plot, as ordinary markdown. The vertical guides mark ICD
# revisions, which are now the only seams in these series: every year comes
# from the NBER mirror, so there is no source join left to warn about.
brks <- ICD_BREAKS[ICD_BREAKS > w$from & ICD_BREAKS <= w$to]
notes <- c(
paste0("**What this covers.** ", w$what),
"",
paste0("**Years shown.** ", w$from, " to ", w$to, ". ", w$note),
"")
if (length(brks)) {
notes <- c(notes,
paste0("**Dashed vertical lines** mark ICD revision boundaries (",
paste(brks, collapse = ", "),
"). A step at one of these is the classification changing, not ",
"necessarily mortality."),
"")
}
notes <- c(notes,
paste0("**One source throughout.** Deaths for every year come from the ",
"NBER mirror of the NCHS Multiple Cause-of-Death files, so nothing ",
"in this series is a change of data source."),
"")
if (!is.null(CAUSE_EXTRA[[cause_name]])) {
notes <- c(notes, CAUSE_EXTRA[[cause_name]], "")
}
paste(c("",
paste0("### ", cause_name),
"",
"::: {.panel-tabset}",
"",
tabs,
":::",
"",
notes,
""),
collapse = "\n")
}Reference
Highlighted cause-specific panels follow, each one a slice of this. They are a selection, not the full cause list; the whole list is in the interactive version and in the table further down.
All causes
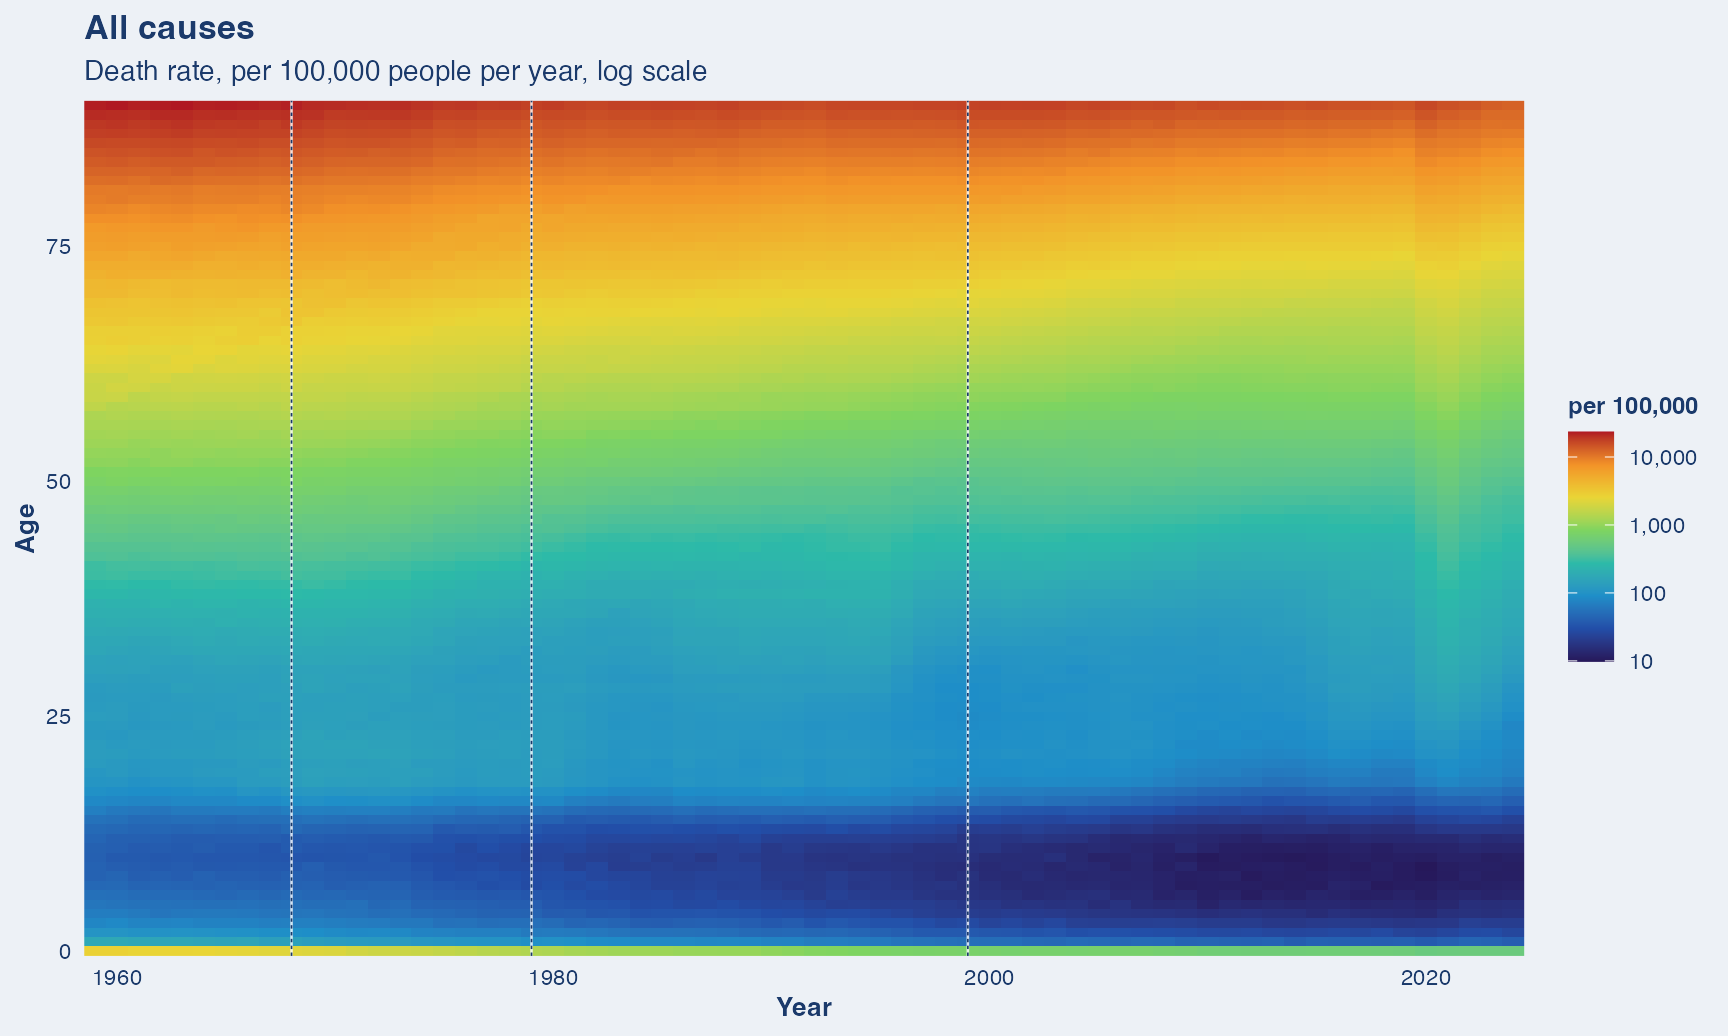
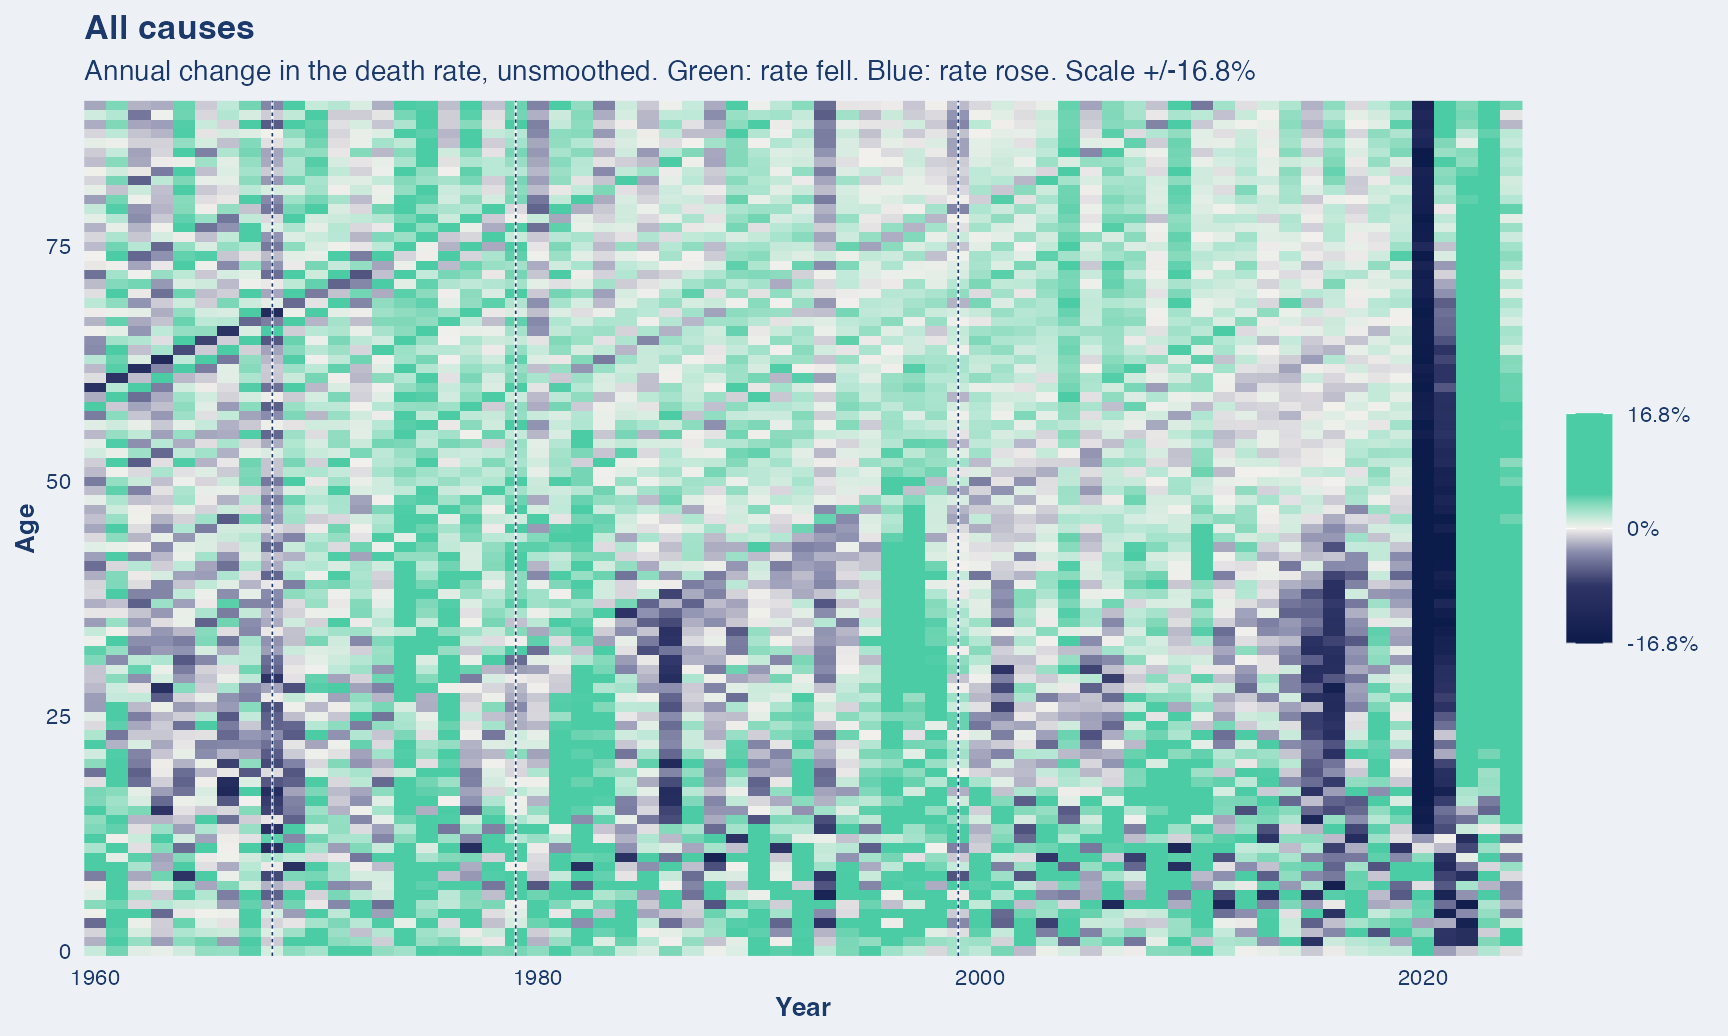
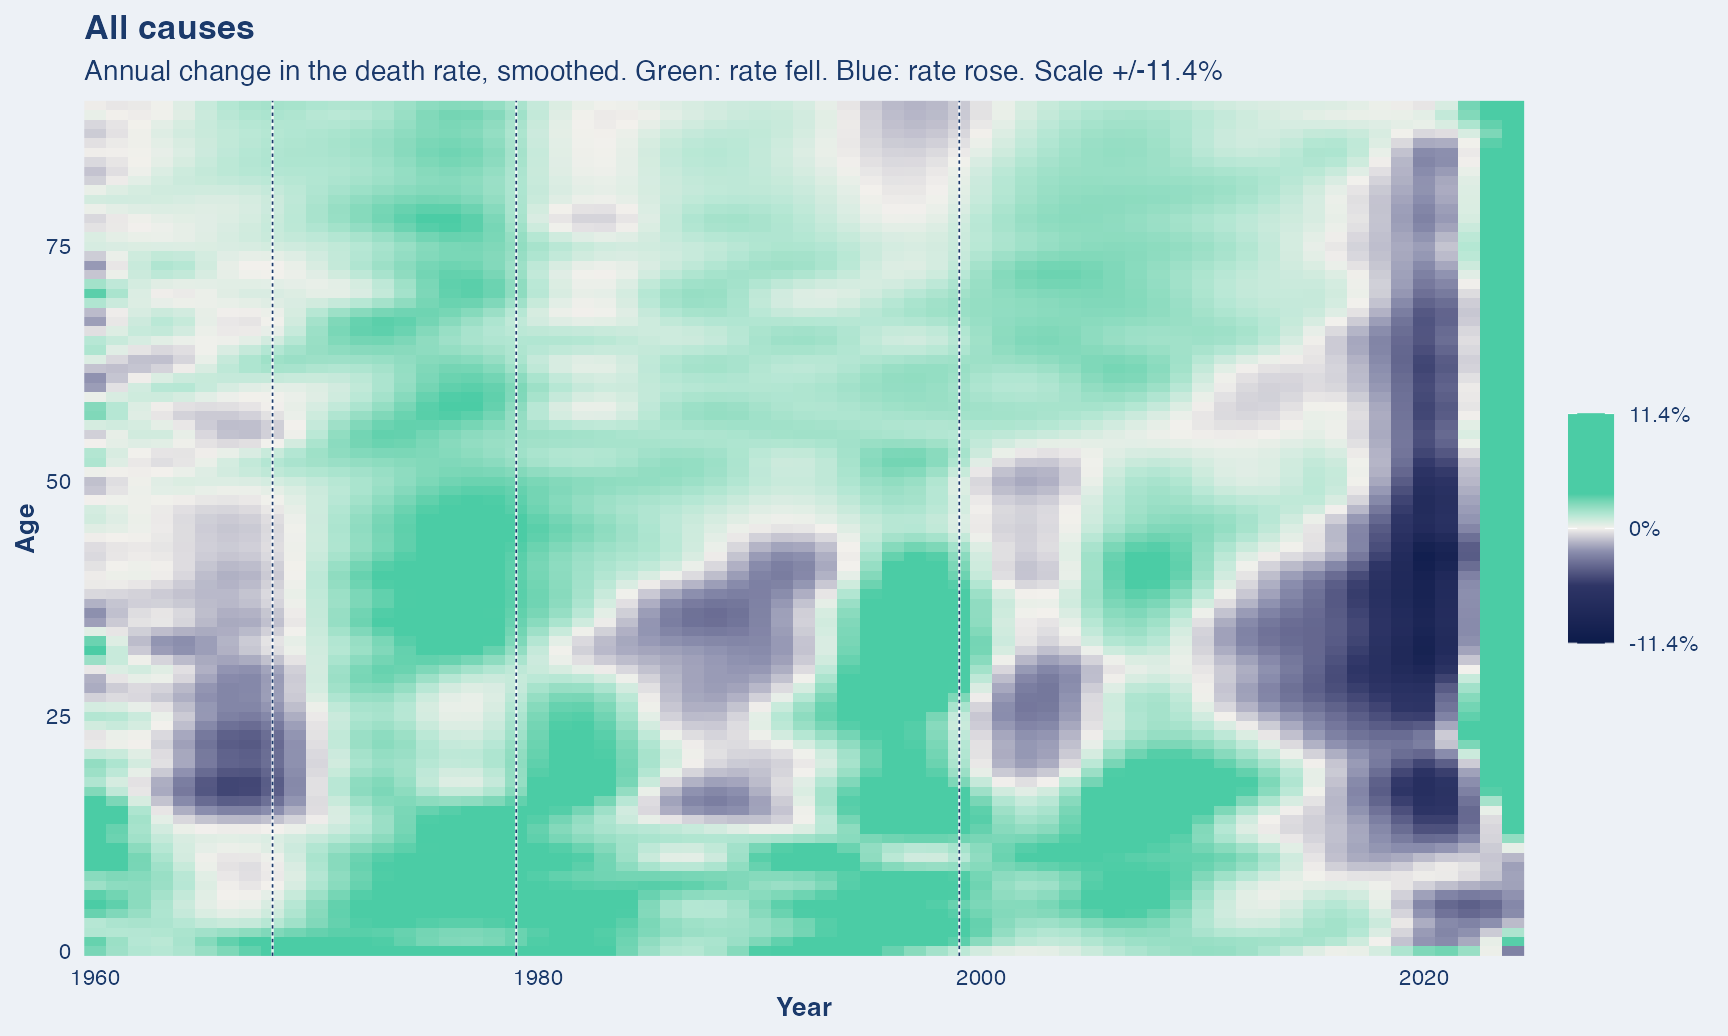
What this covers. Every death, whatever the cause.
Years shown. 1959 to 2024. No crosswalk needed: every death is counted whatever its code.
Dashed vertical lines mark ICD revision boundaries (1968, 1979, 1999). A step at one of these is the classification changing, not necessarily mortality.
One source throughout. Deaths for every year come from the NBER mirror of the NCHS Multiple Cause-of-Death files, so nothing in this series is a change of data source.
Cancers
Cancer
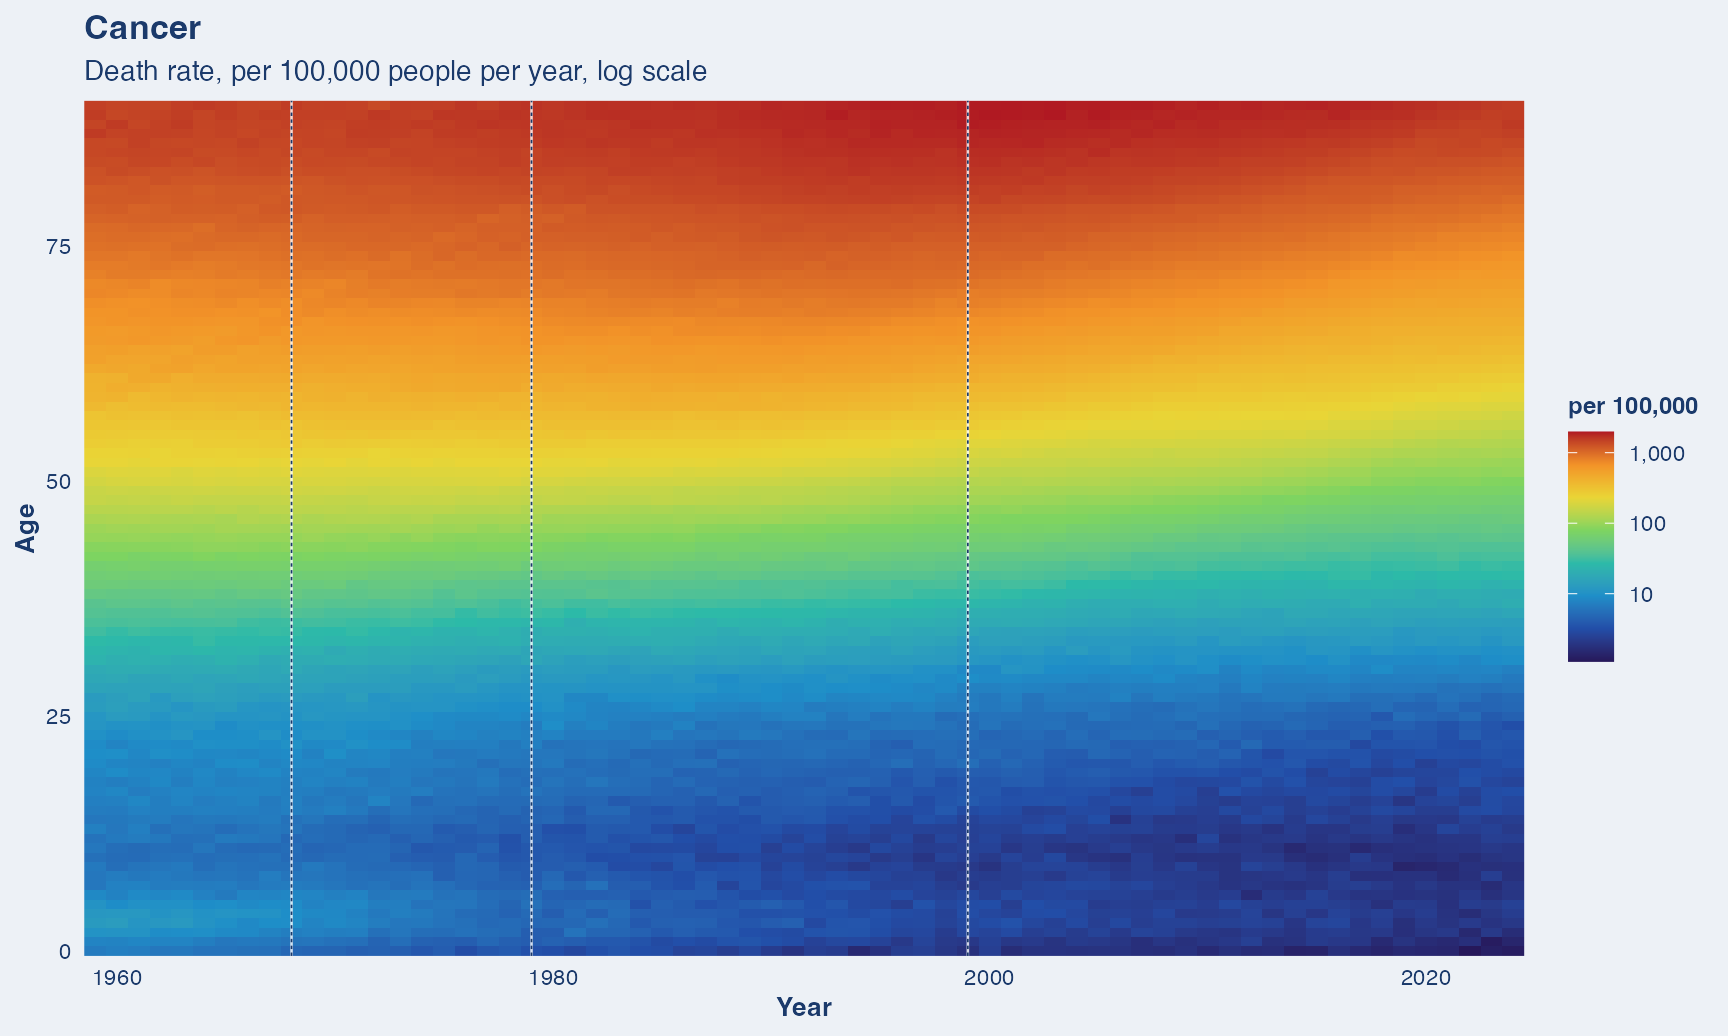
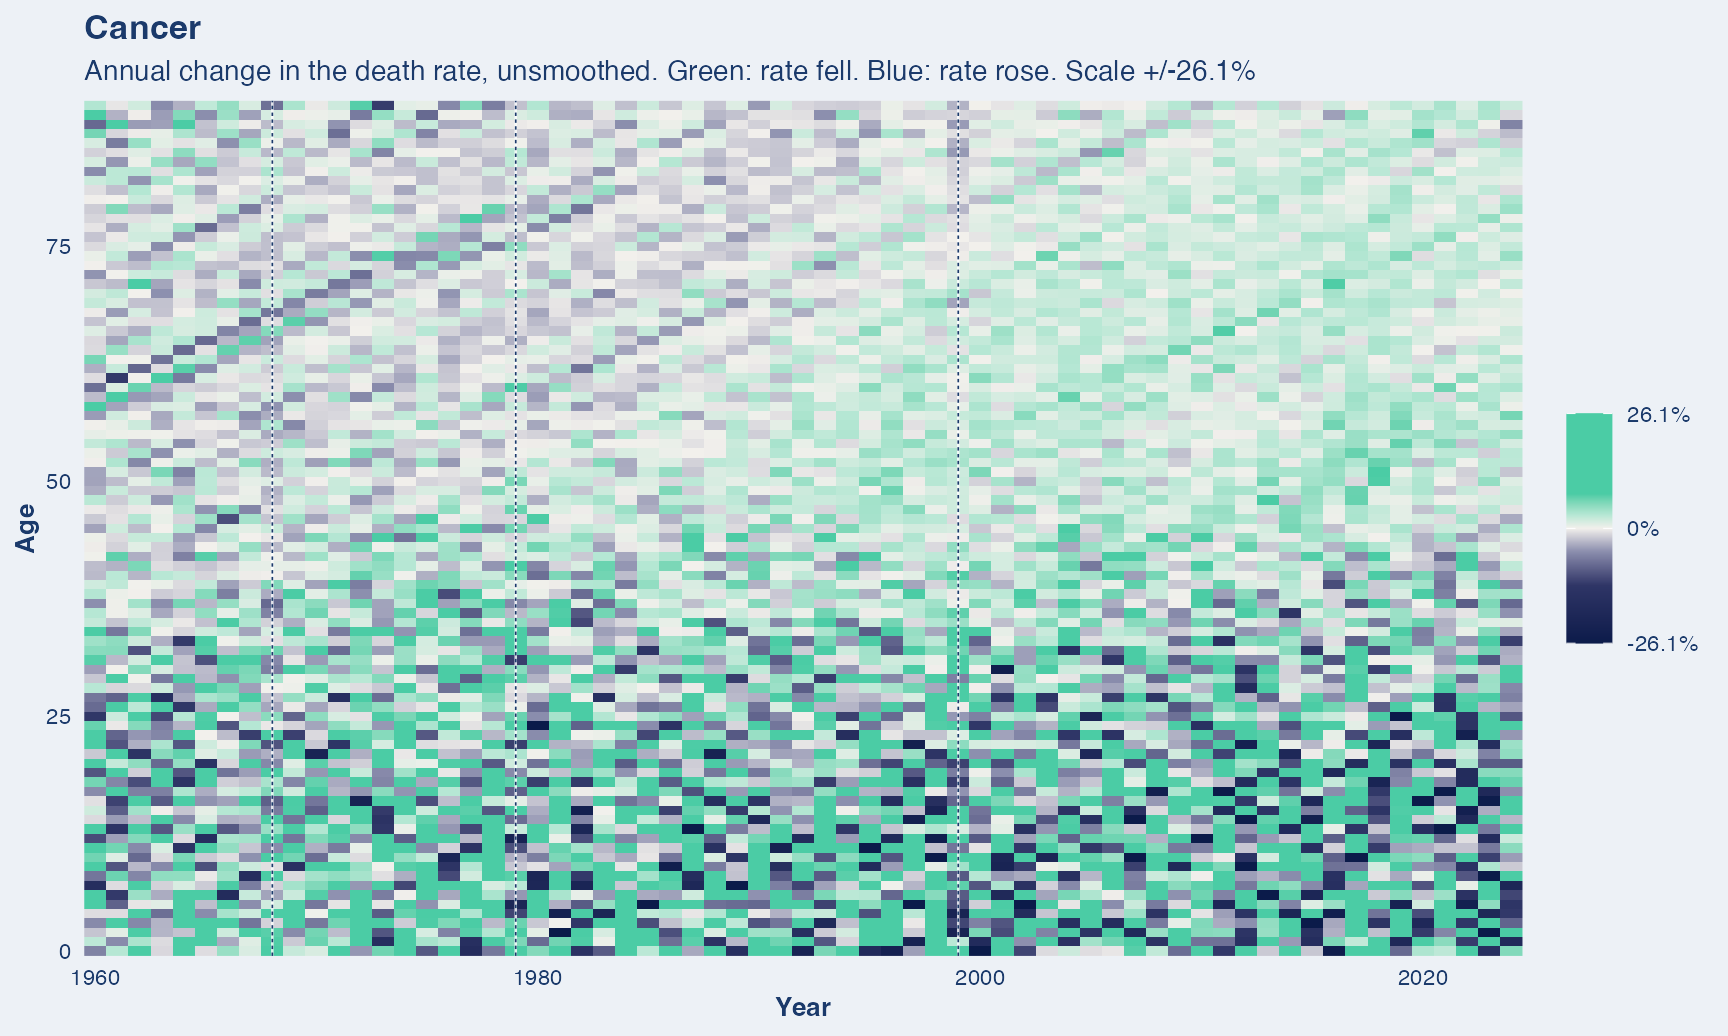
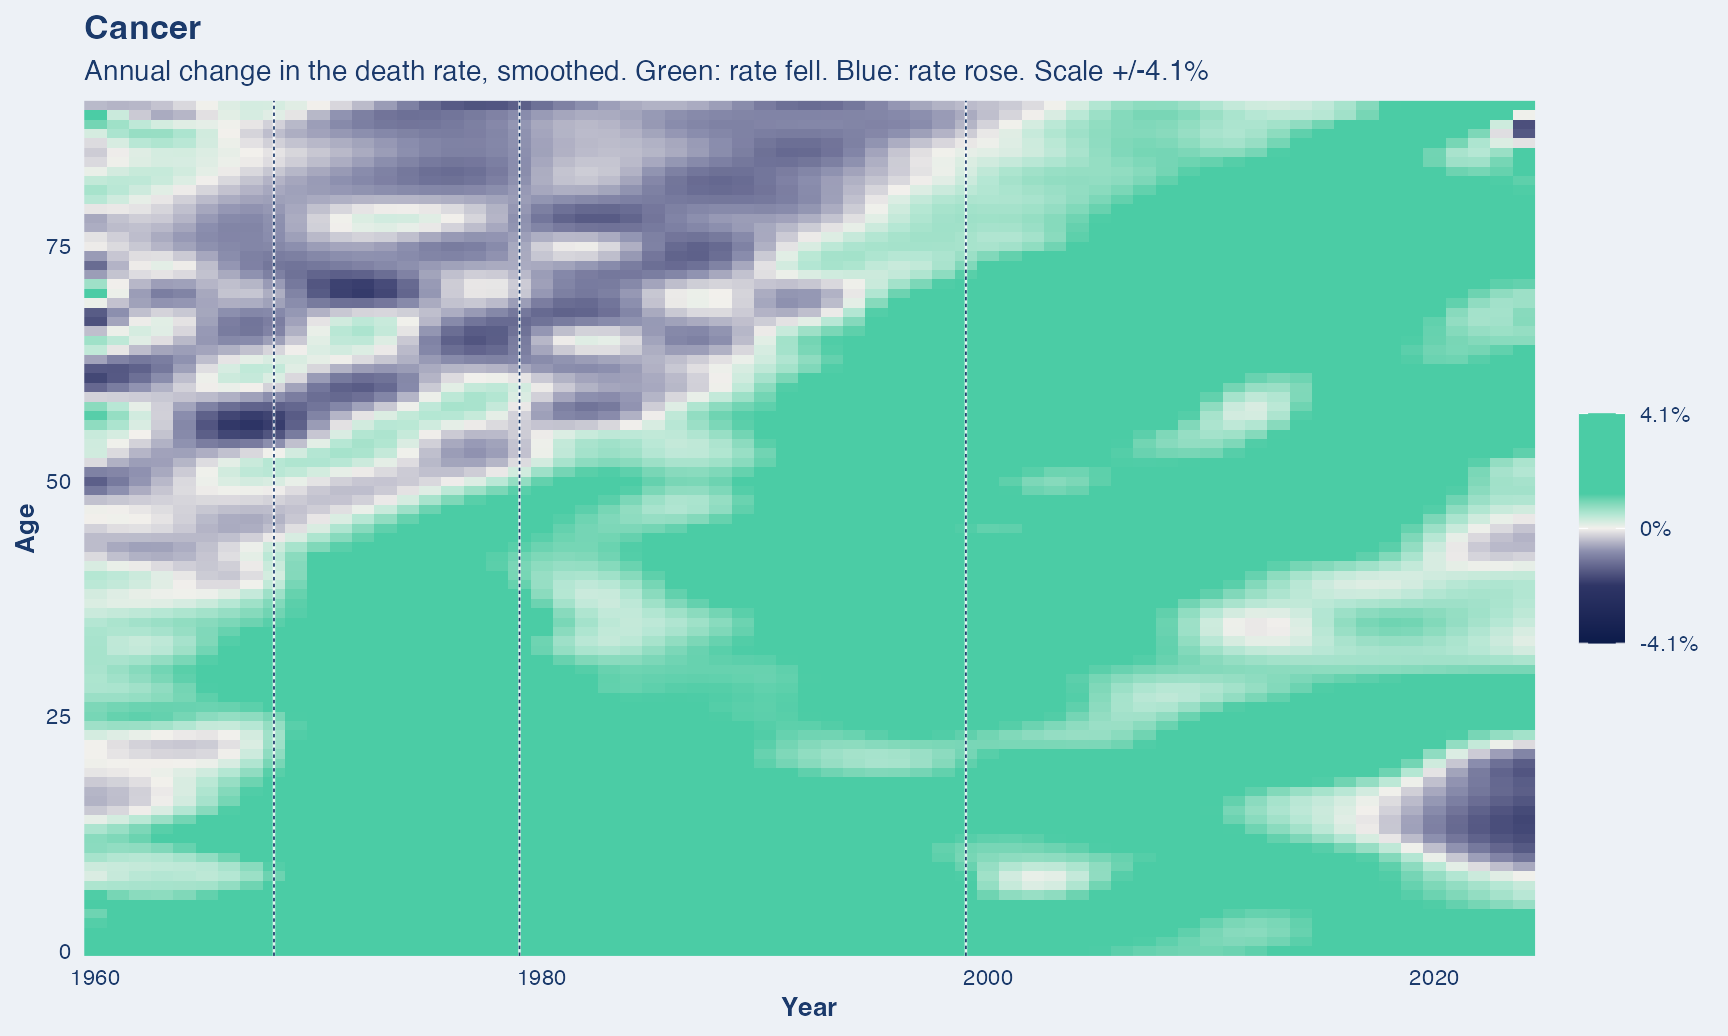
What this covers. All malignant tumours, any site.
Years shown. 1959 to 2024. A whole ICD chapter. Broad groups like this carry across the 1968, 1979 and 1999 revisions with little change.
Dashed vertical lines mark ICD revision boundaries (1968, 1979, 1999). A step at one of these is the classification changing, not necessarily mortality.
One source throughout. Deaths for every year come from the NBER mirror of the NCHS Multiple Cause-of-Death files, so nothing in this series is a change of data source.
Lung cancer
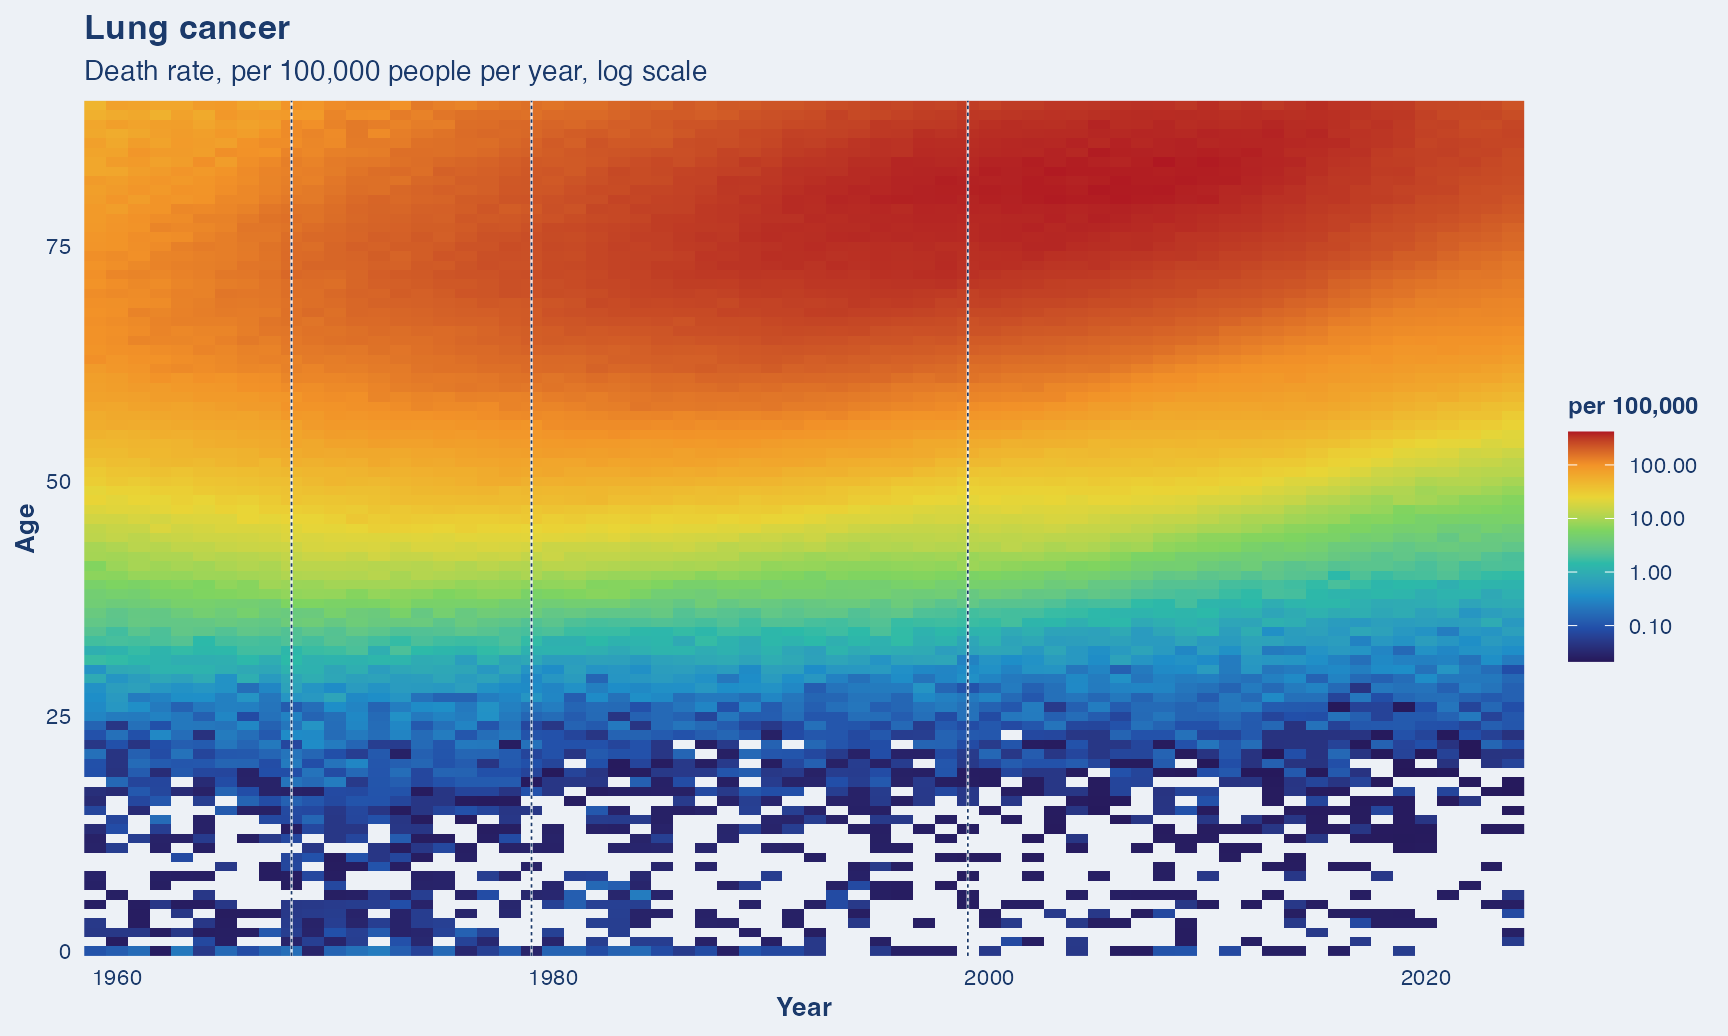
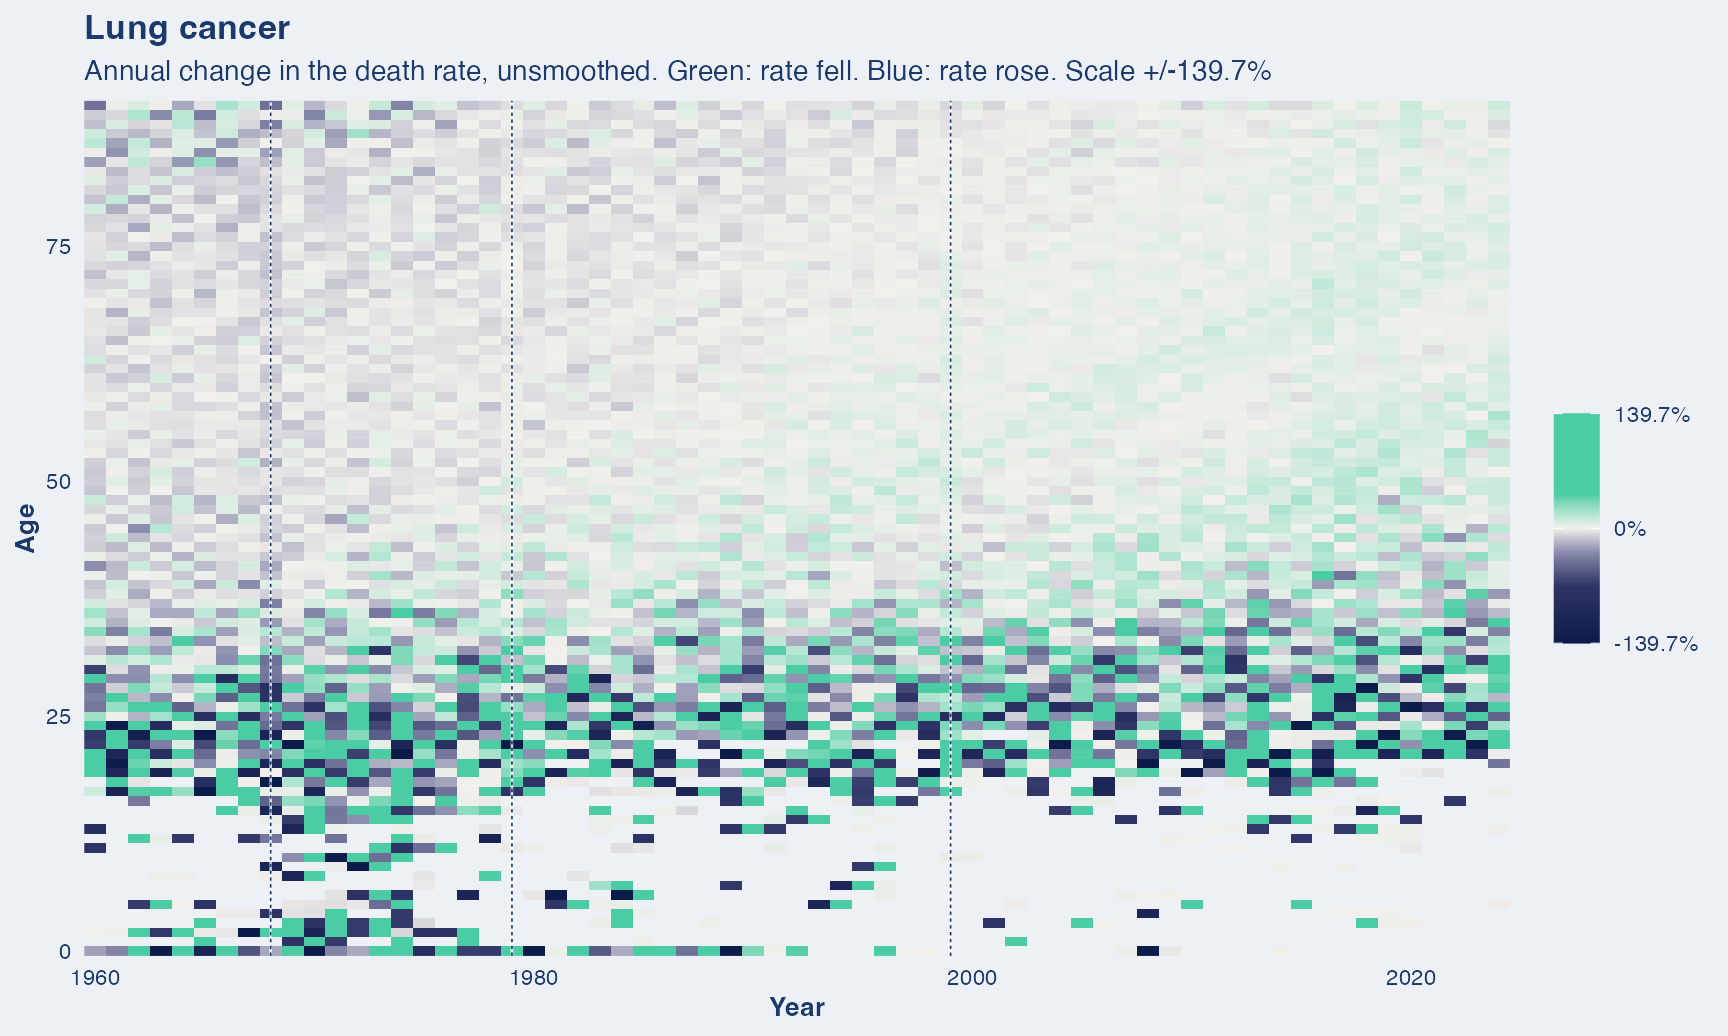
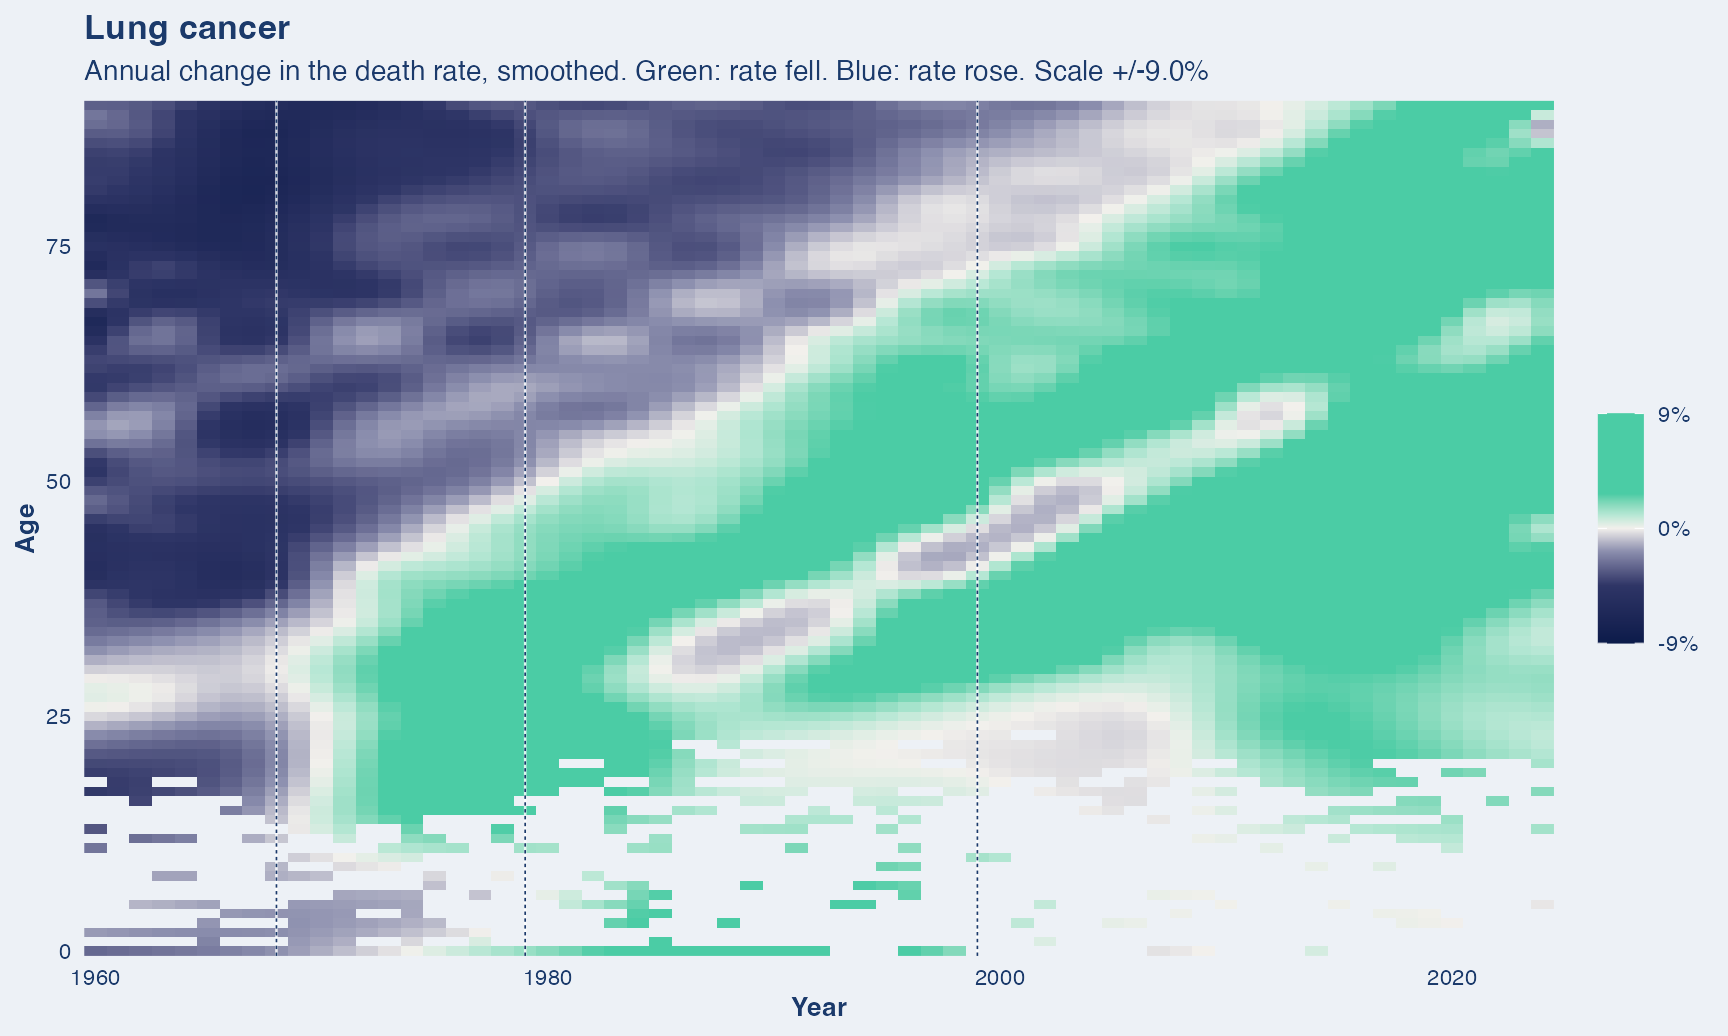
What this covers. Cancer of the trachea, bronchus and lung.
Years shown. 1959 to 2024. A single anatomical site. Site definitions changed little across the revisions.
Dashed vertical lines mark ICD revision boundaries (1968, 1979, 1999). A step at one of these is the classification changing, not necessarily mortality.
One source throughout. Deaths for every year come from the NBER mirror of the NCHS Multiple Cause-of-Death files, so nothing in this series is a change of data source.
Colorectal cancer
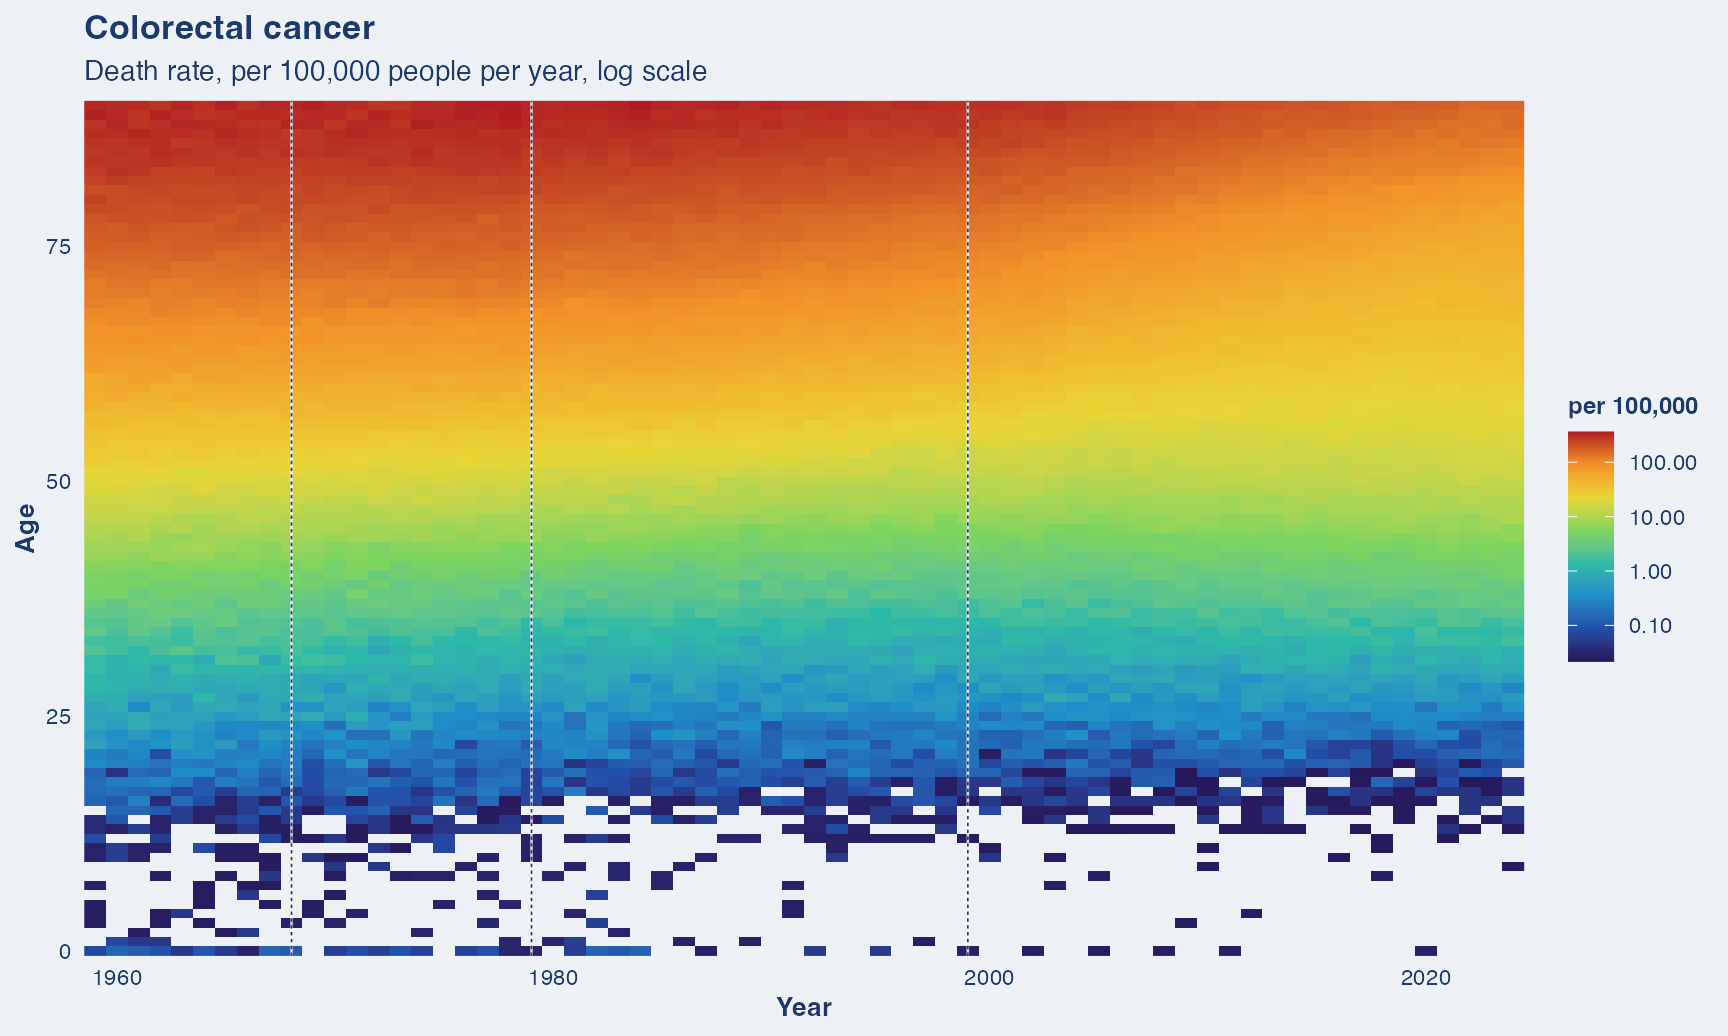
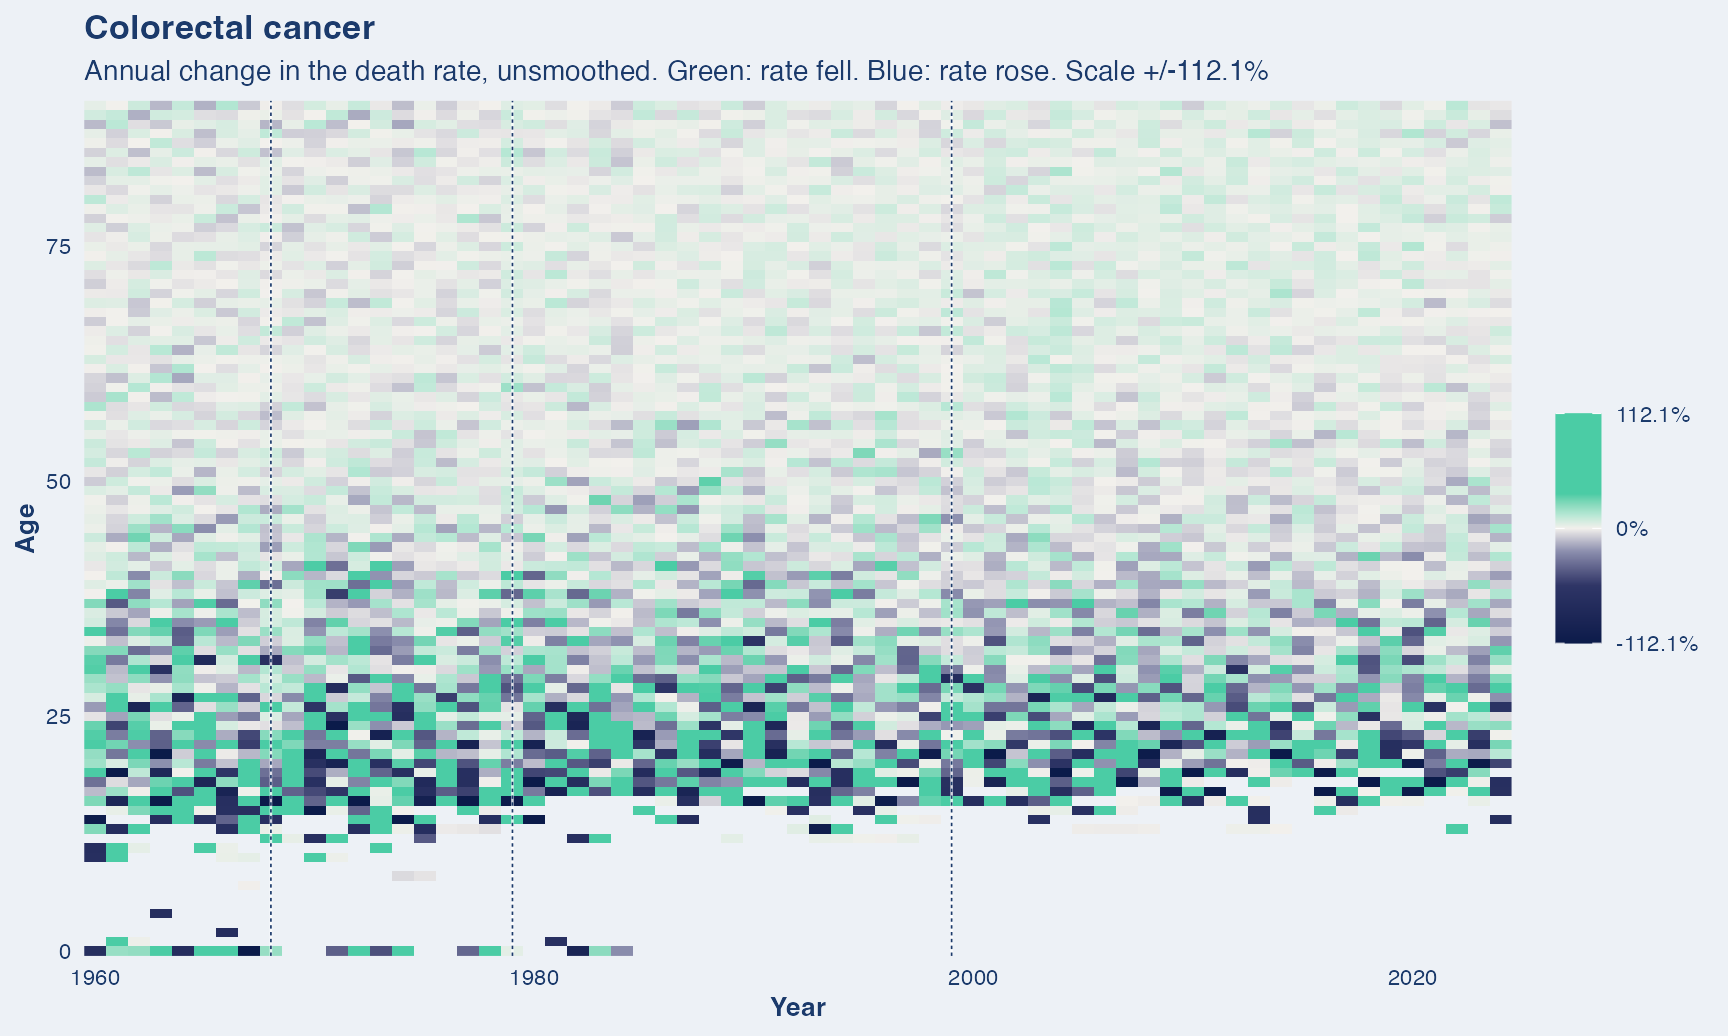
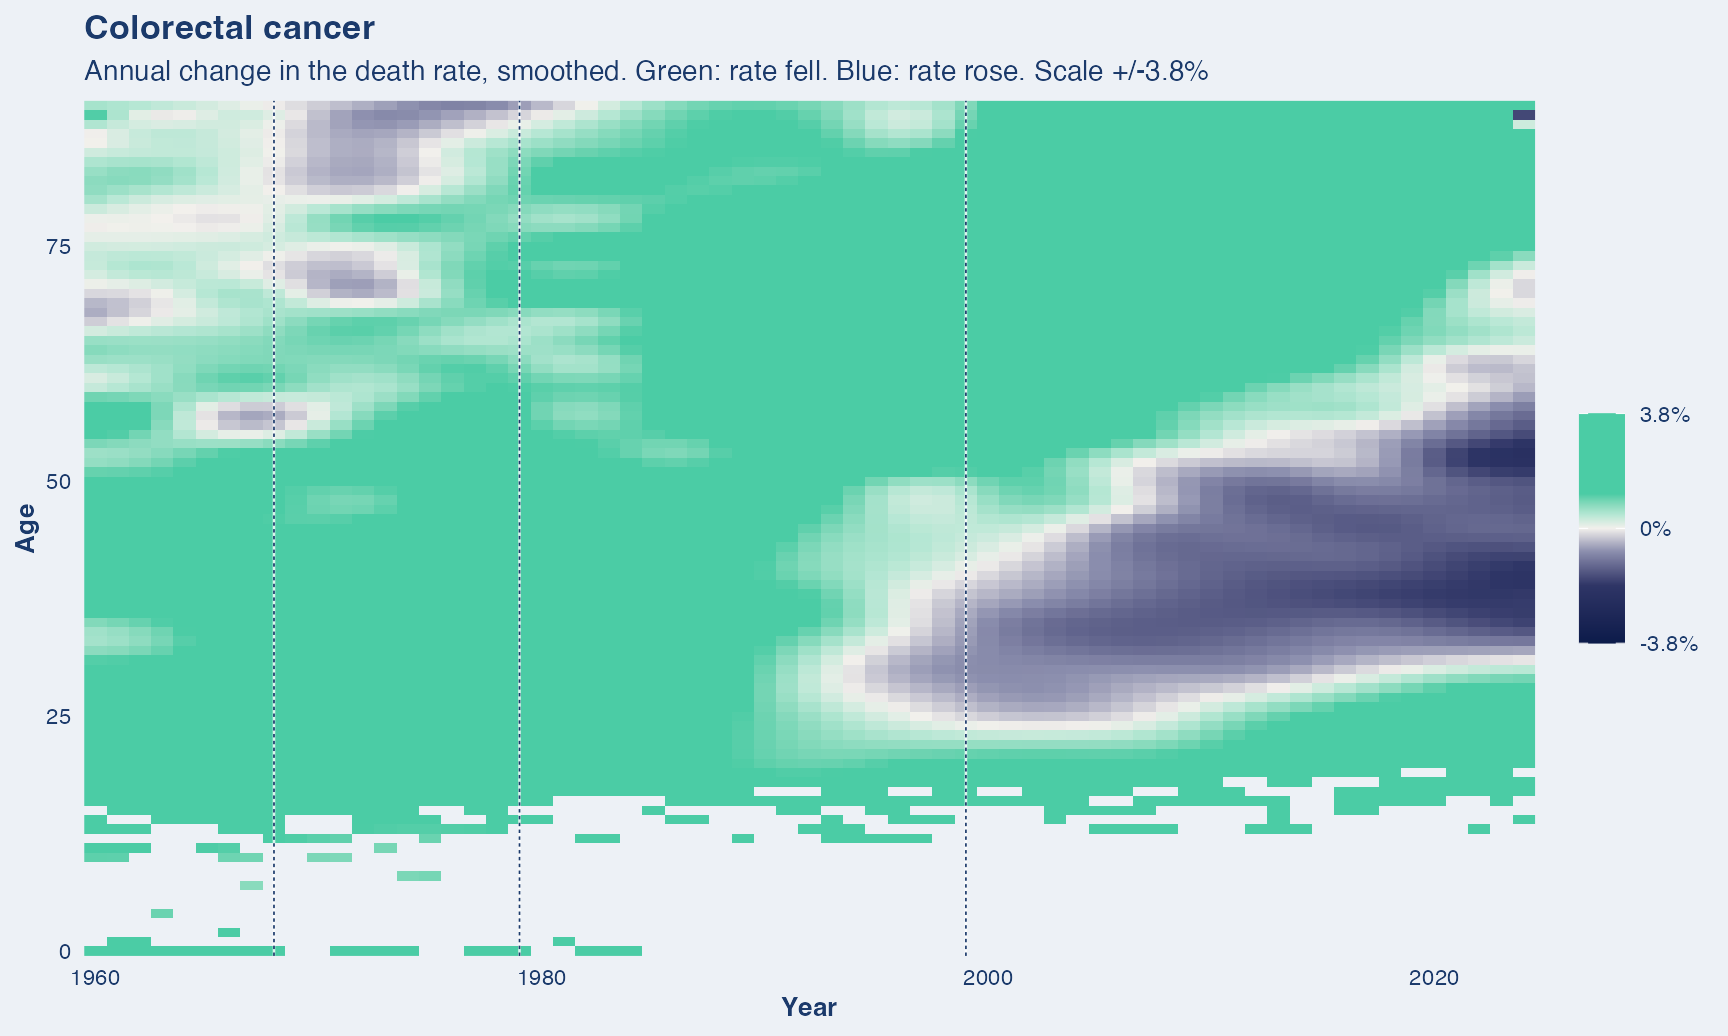
What this covers. Cancer of the colon, rectum and anus.
Years shown. 1959 to 2024. A single anatomical site. Site definitions changed little across the revisions.
Dashed vertical lines mark ICD revision boundaries (1968, 1979, 1999). A step at one of these is the classification changing, not necessarily mortality.
One source throughout. Deaths for every year come from the NBER mirror of the NCHS Multiple Cause-of-Death files, so nothing in this series is a change of data source.
Cardiovascular disease
Cardiovascular
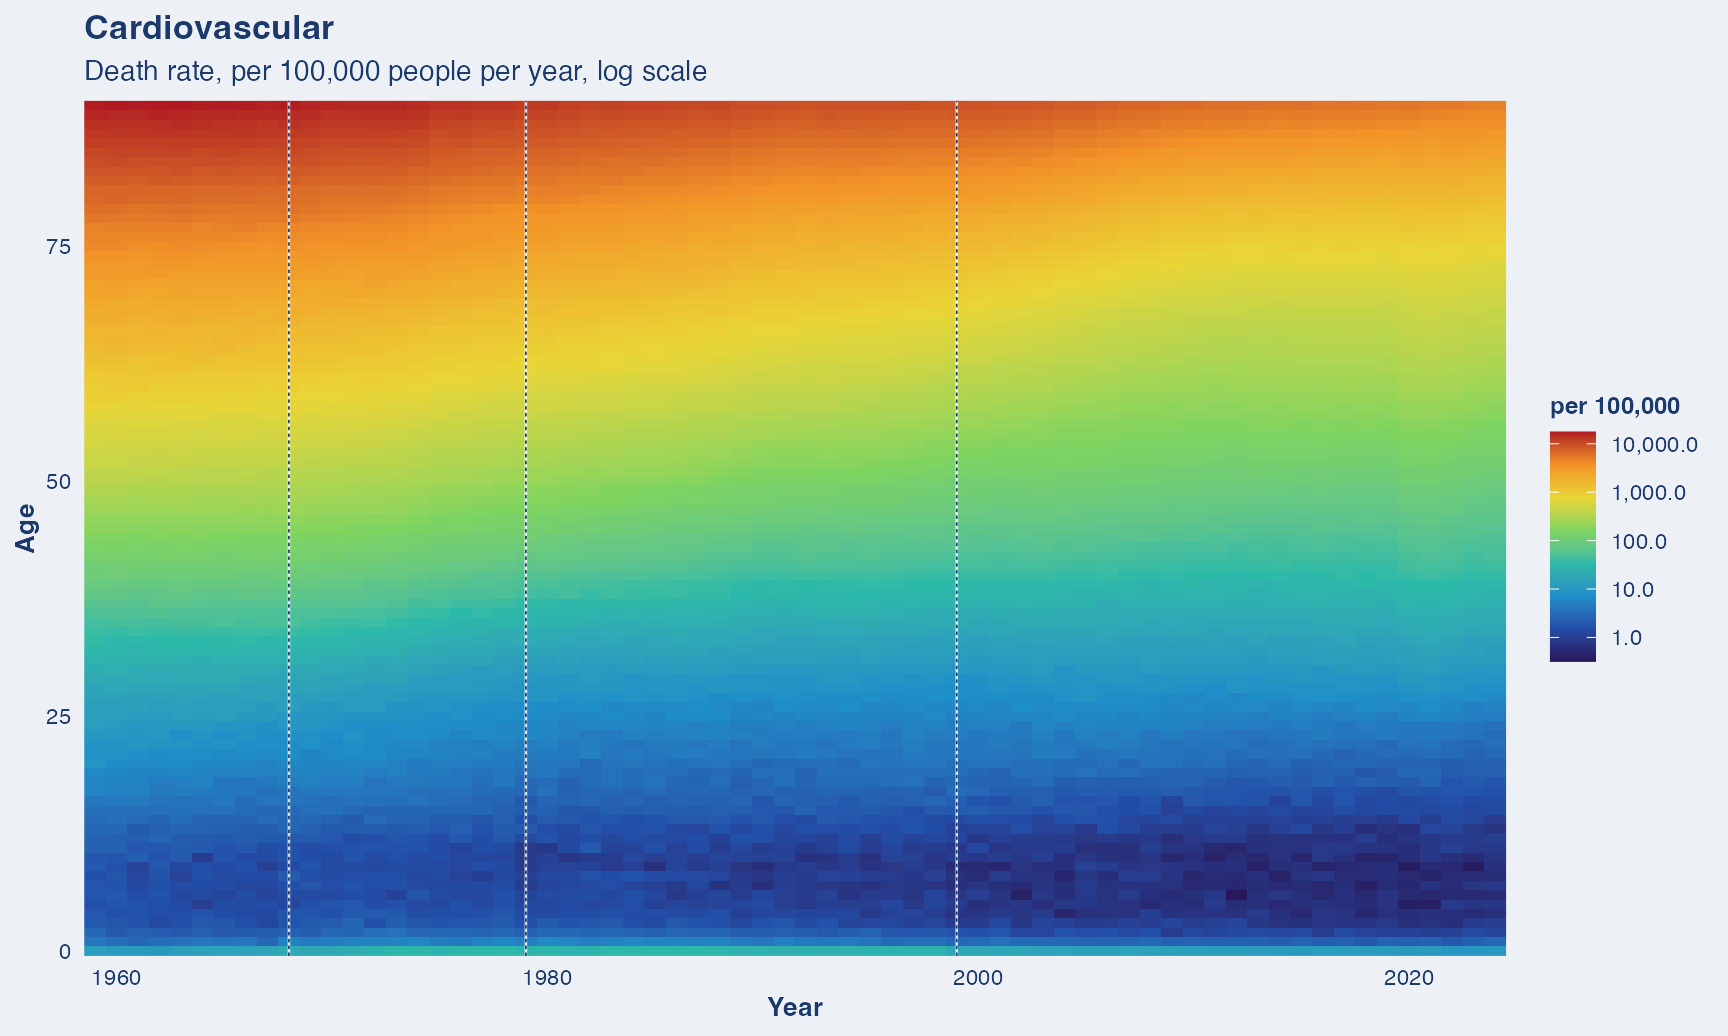
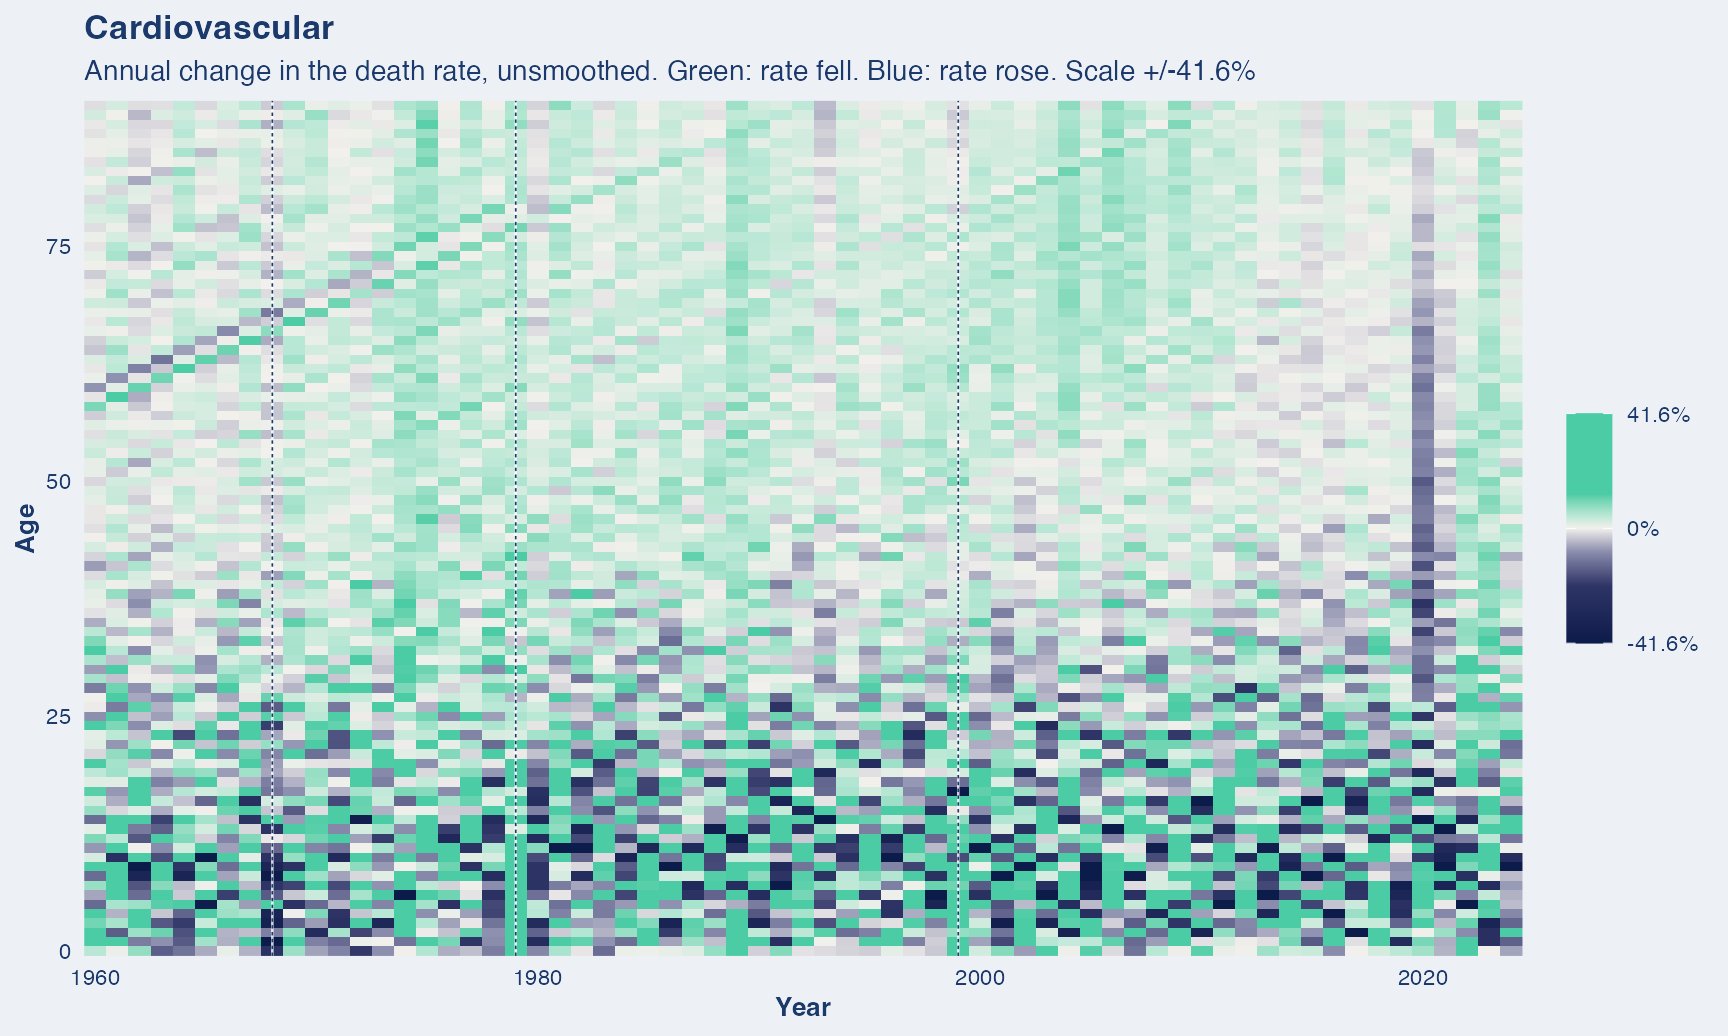
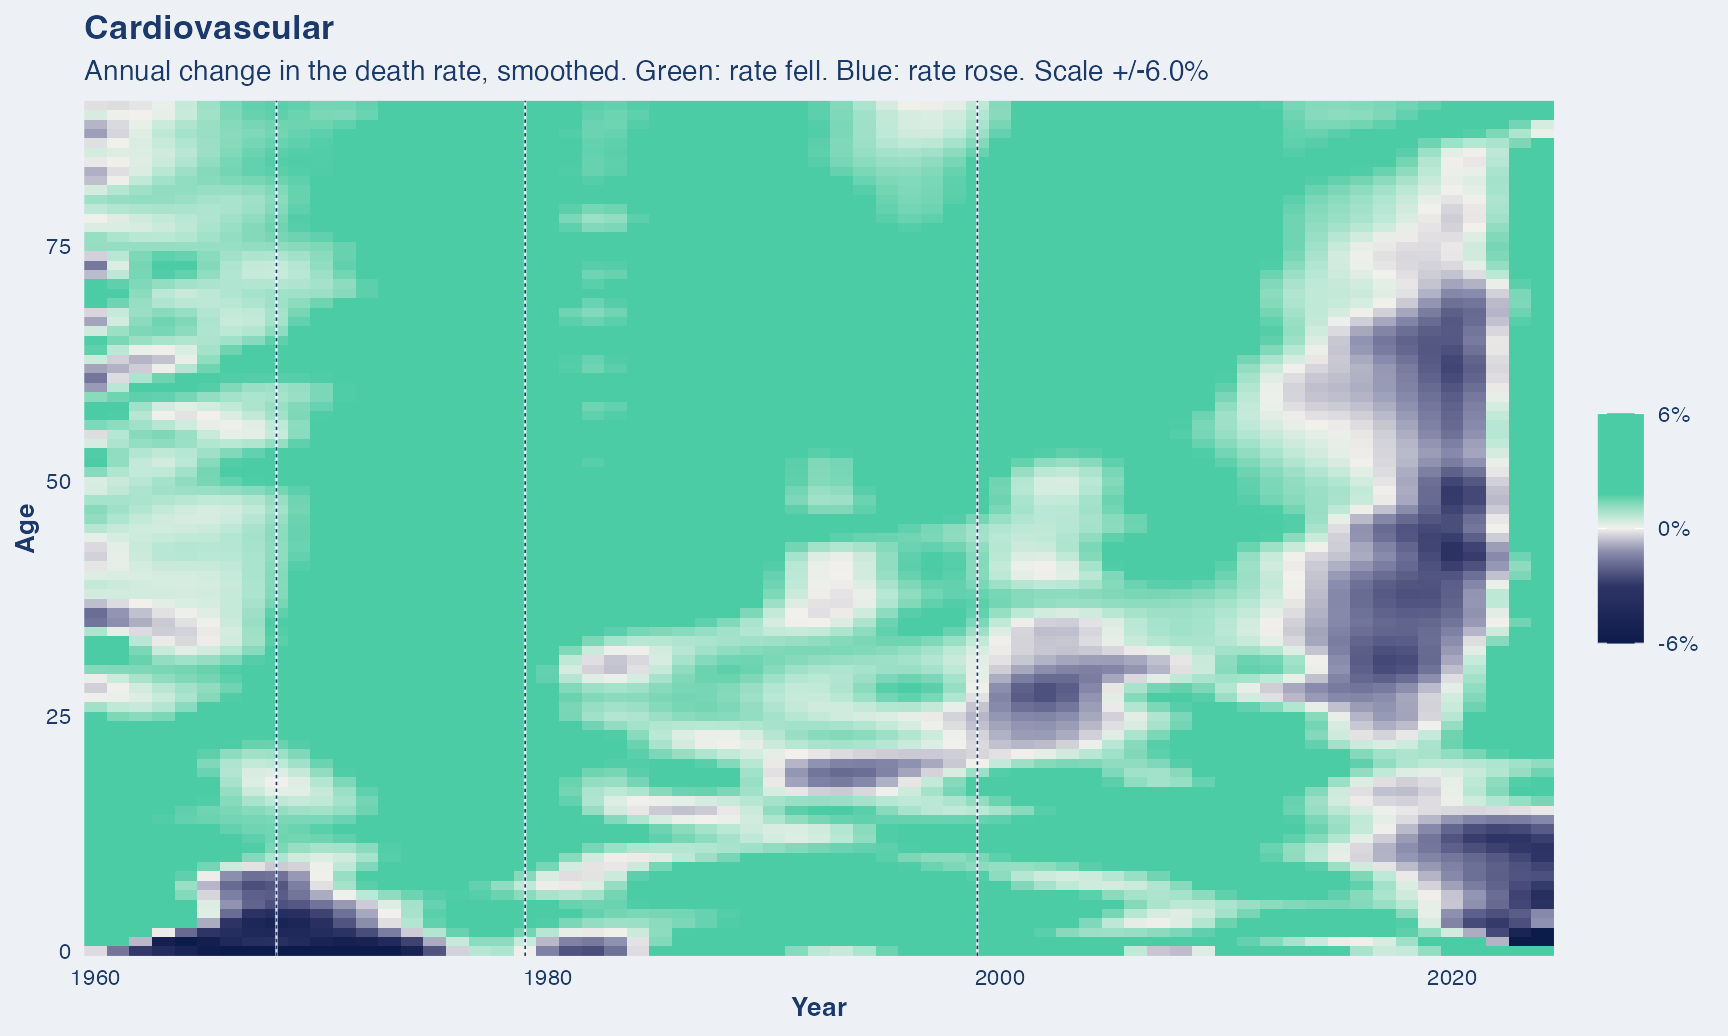
What this covers. All diseases of the heart and blood vessels, including stroke.
Years shown. 1959 to 2024. Under ICD-7 (1959-1967) stroke sits outside the circulatory chapter, so codes 330-334 are added back for those years. Without that, 1959-1967 is understated by about eleven points.
Dashed vertical lines mark ICD revision boundaries (1968, 1979, 1999). A step at one of these is the classification changing, not necessarily mortality.
One source throughout. Deaths for every year come from the NBER mirror of the NCHS Multiple Cause-of-Death files, so nothing in this series is a change of data source.
Heart disease
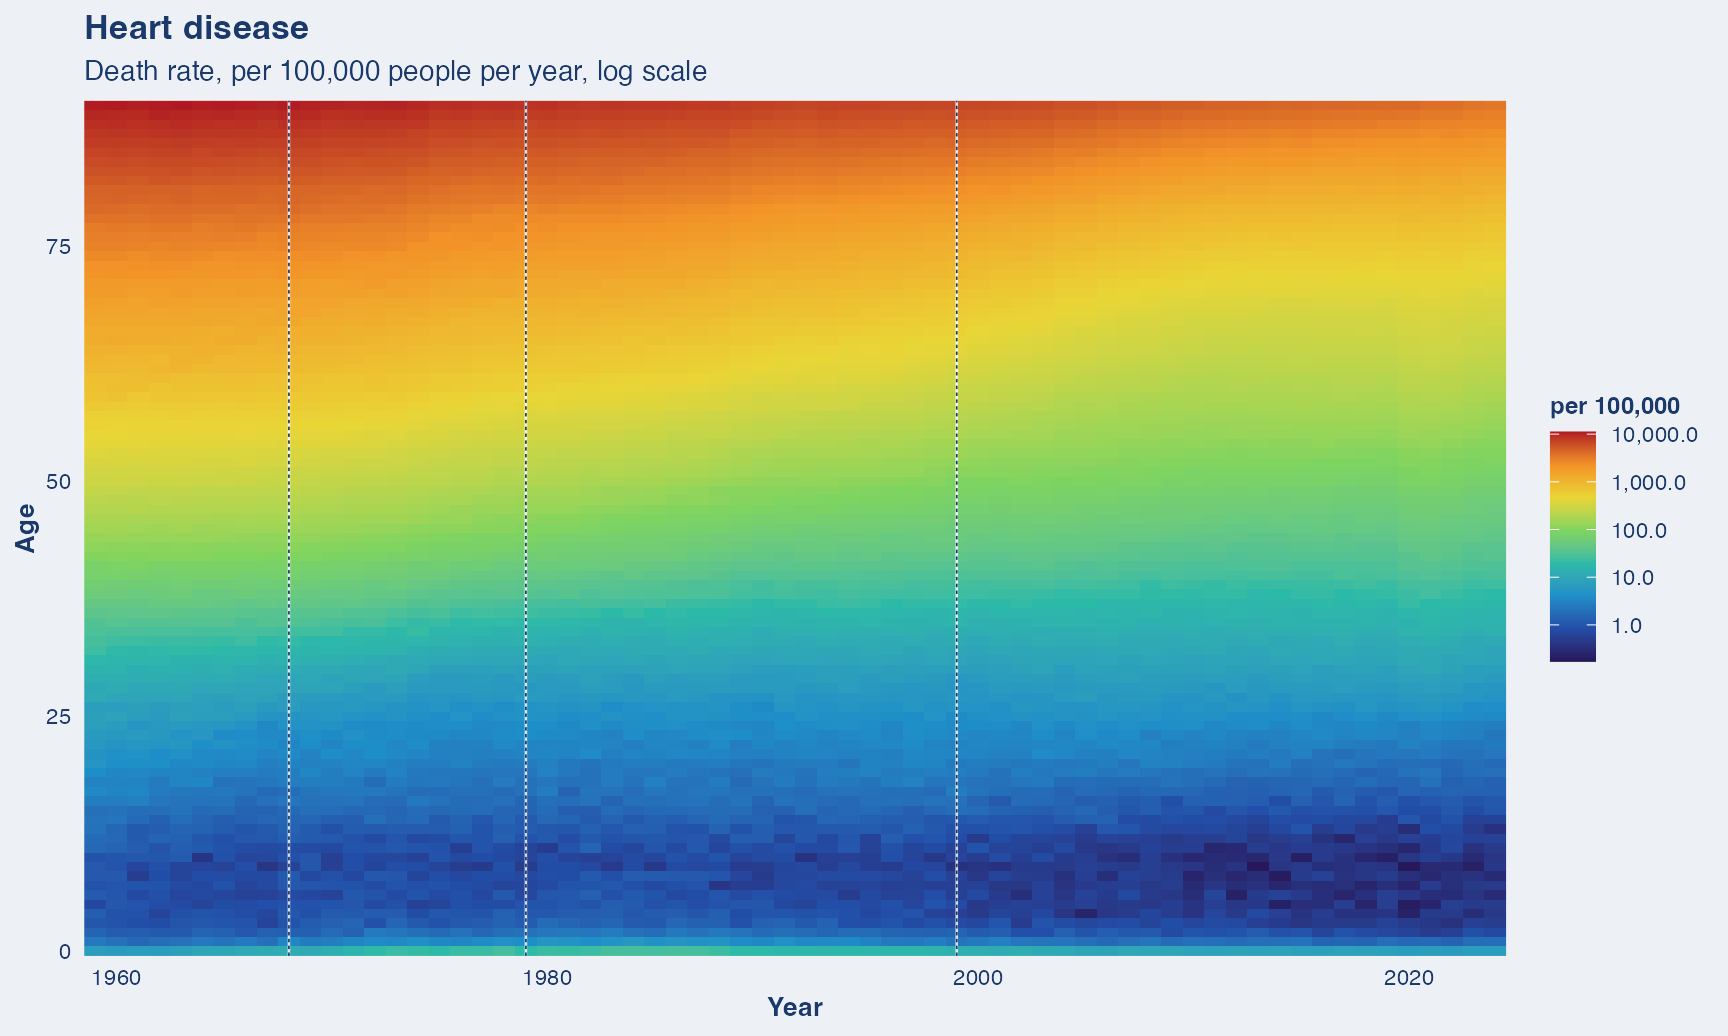
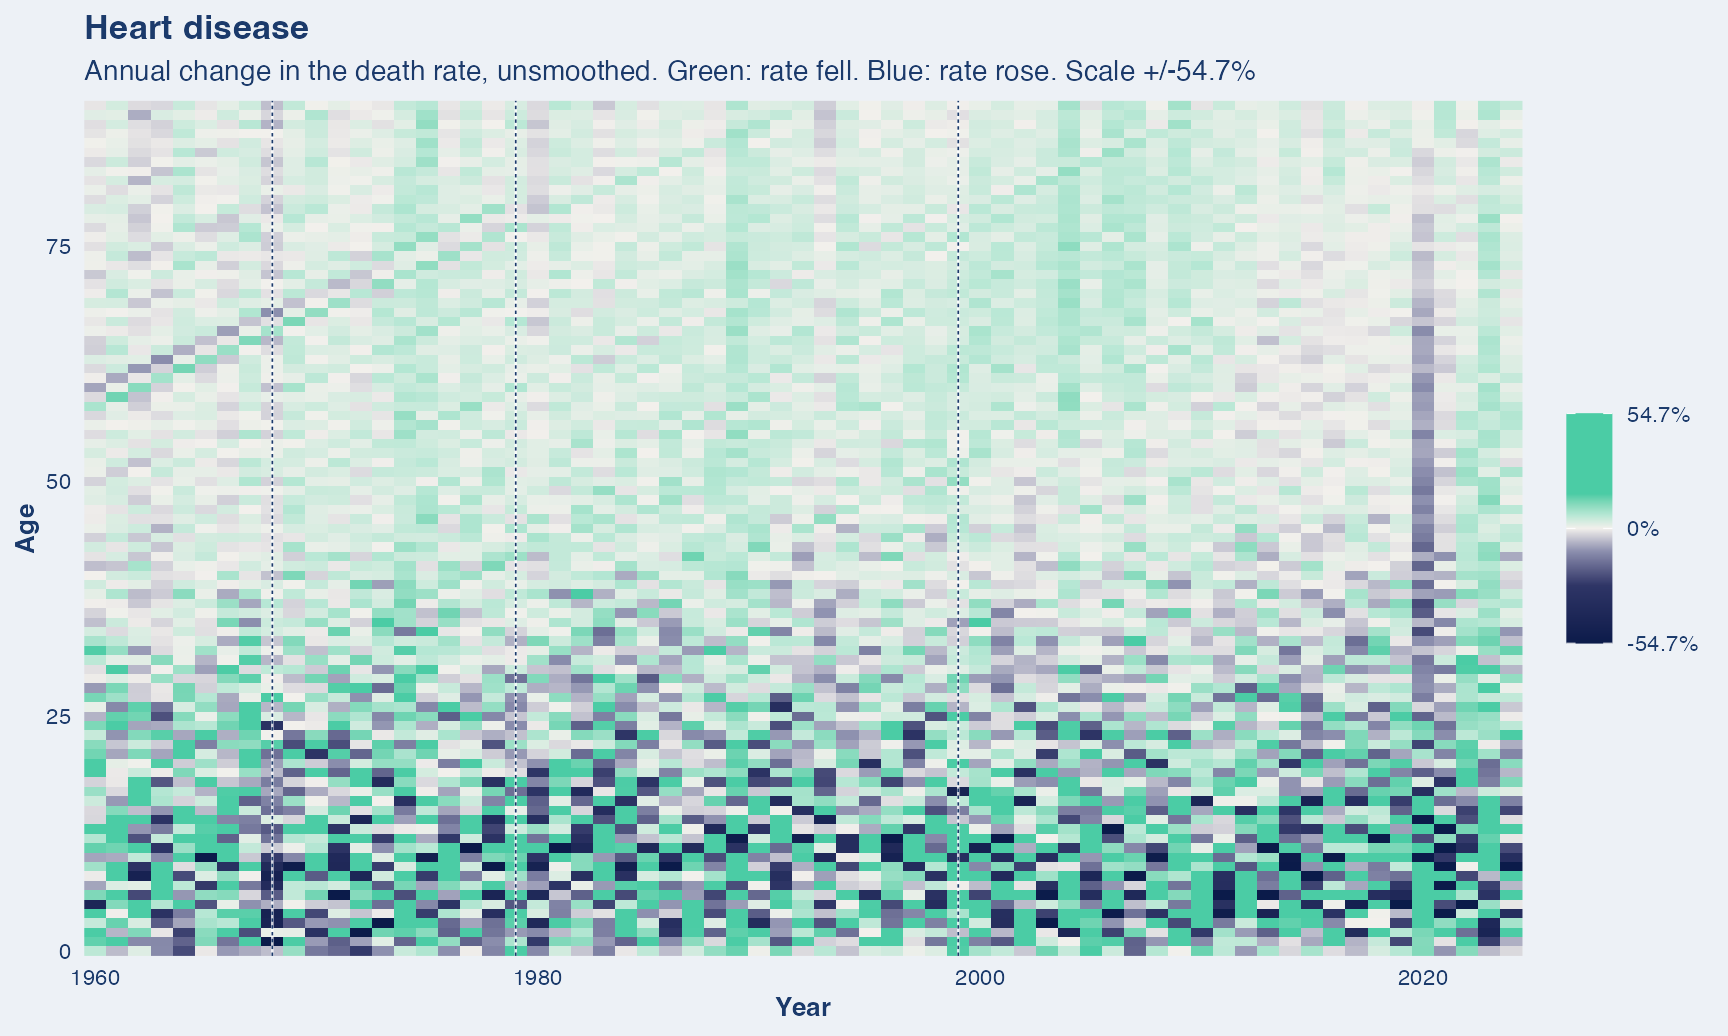
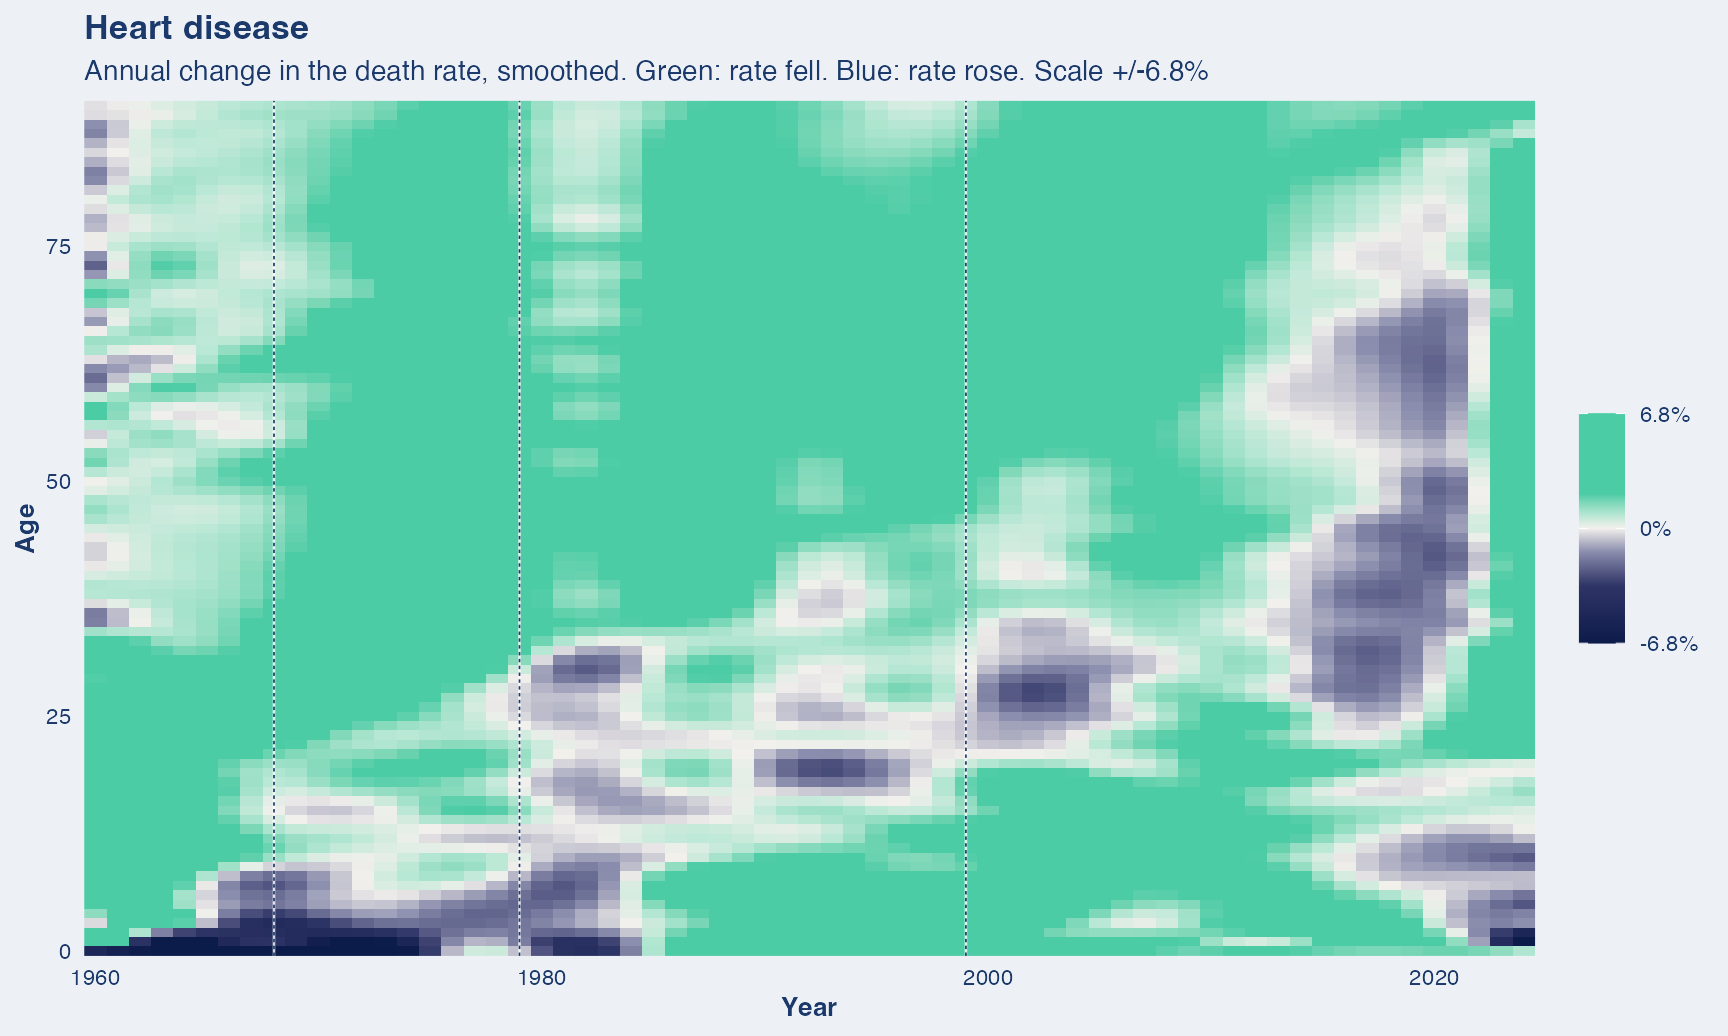
What this covers. Heart conditions specifically: heart attack, heart failure, rheumatic and hypertensive heart disease.
Years shown. 1959 to 2024. Crosswalk checked at the ICD-7 to ICD-8 boundary: this cause holds the same share of all deaths either side of 1968, to about a tenth of a point, so the mapping does not jump there.
Dashed vertical lines mark ICD revision boundaries (1968, 1979, 1999). A step at one of these is the classification changing, not necessarily mortality.
One source throughout. Deaths for every year come from the NBER mirror of the NCHS Multiple Cause-of-Death files, so nothing in this series is a change of data source.
Stroke
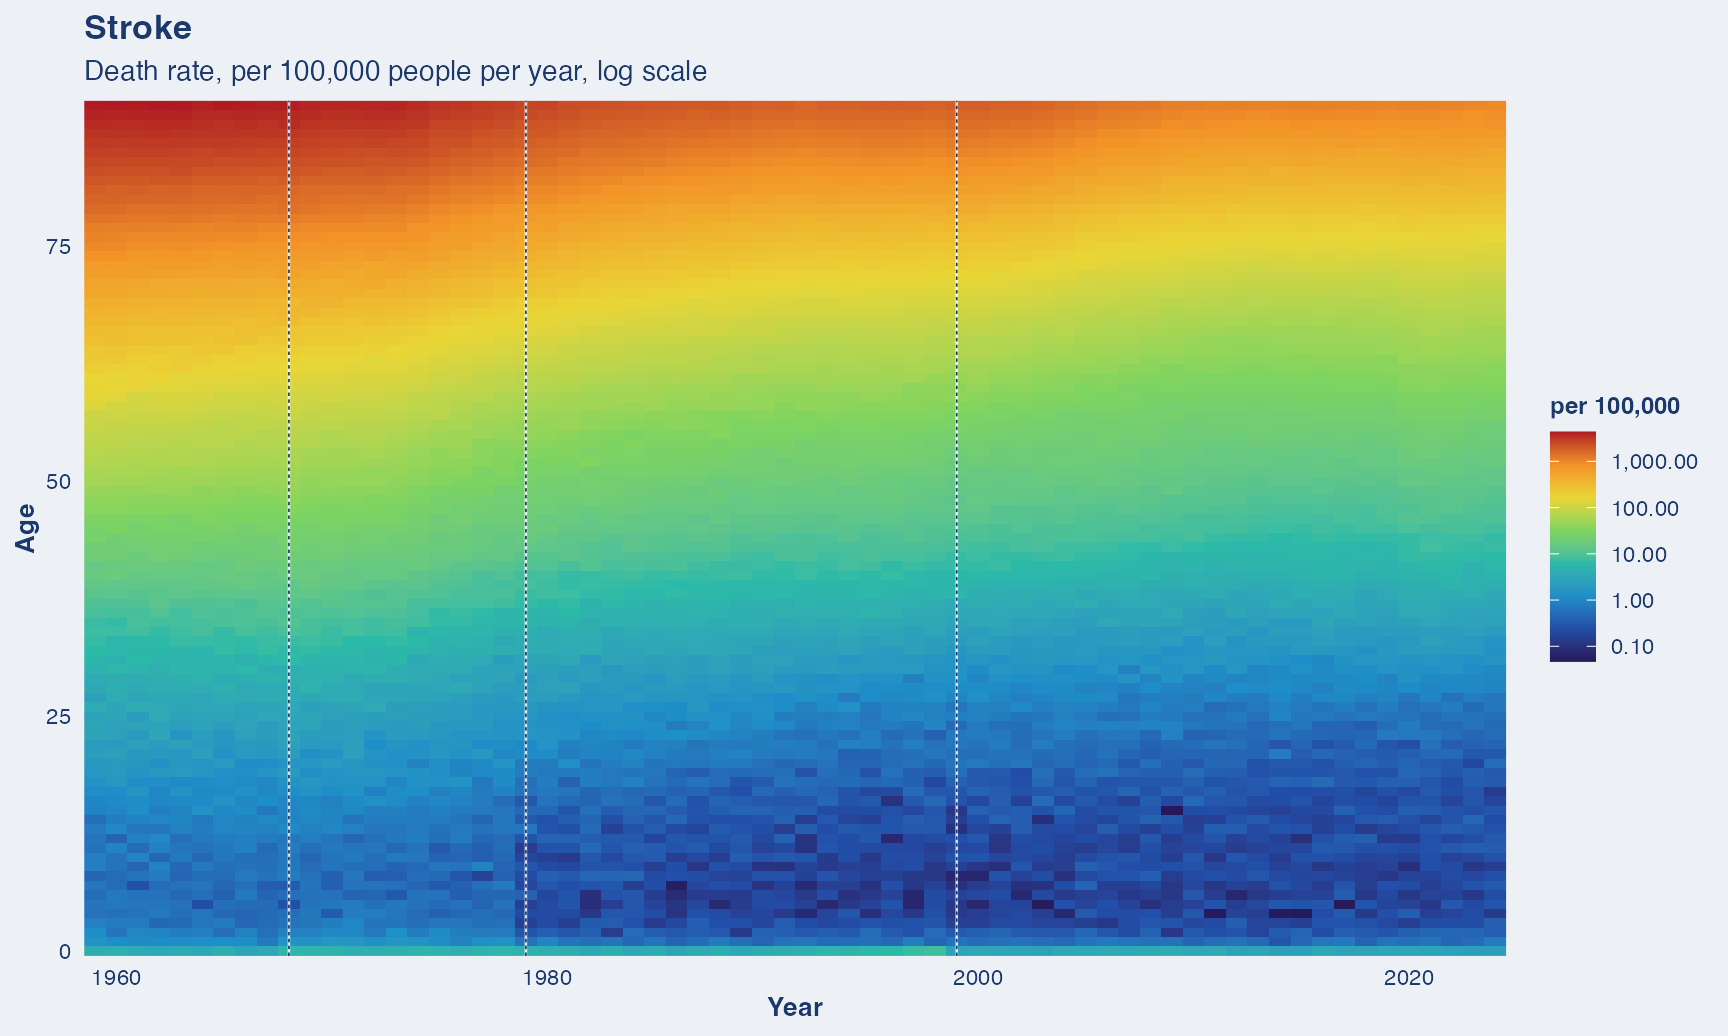
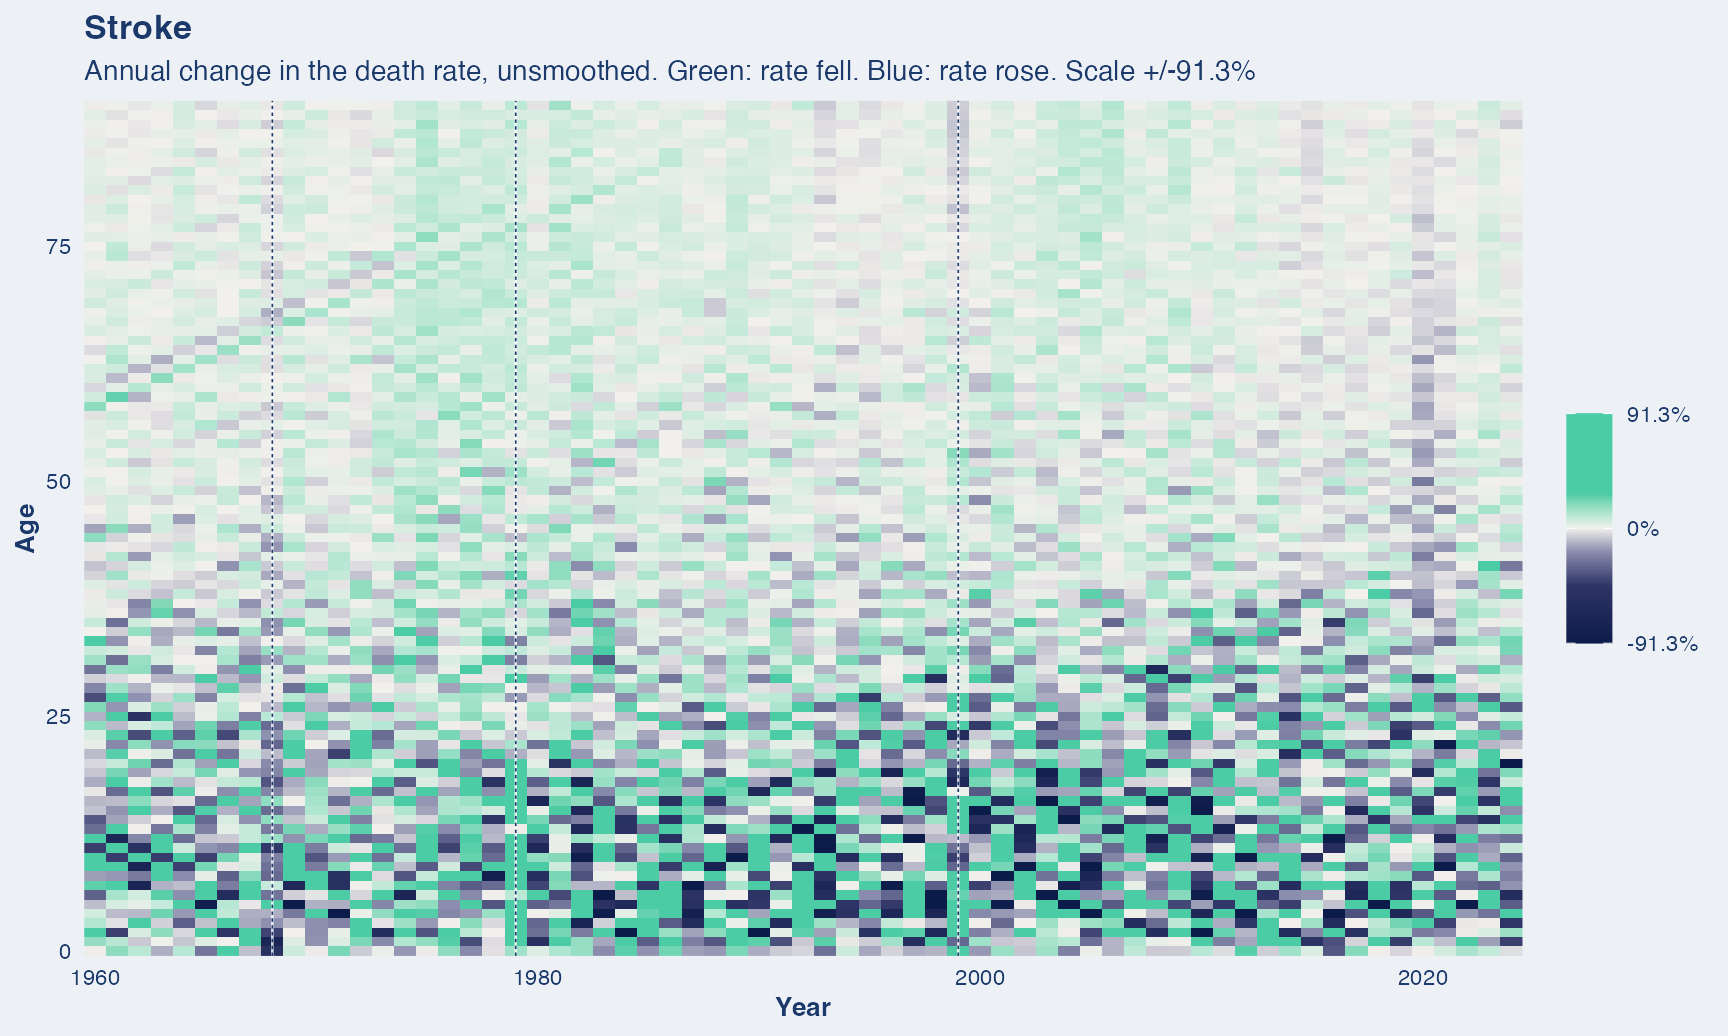
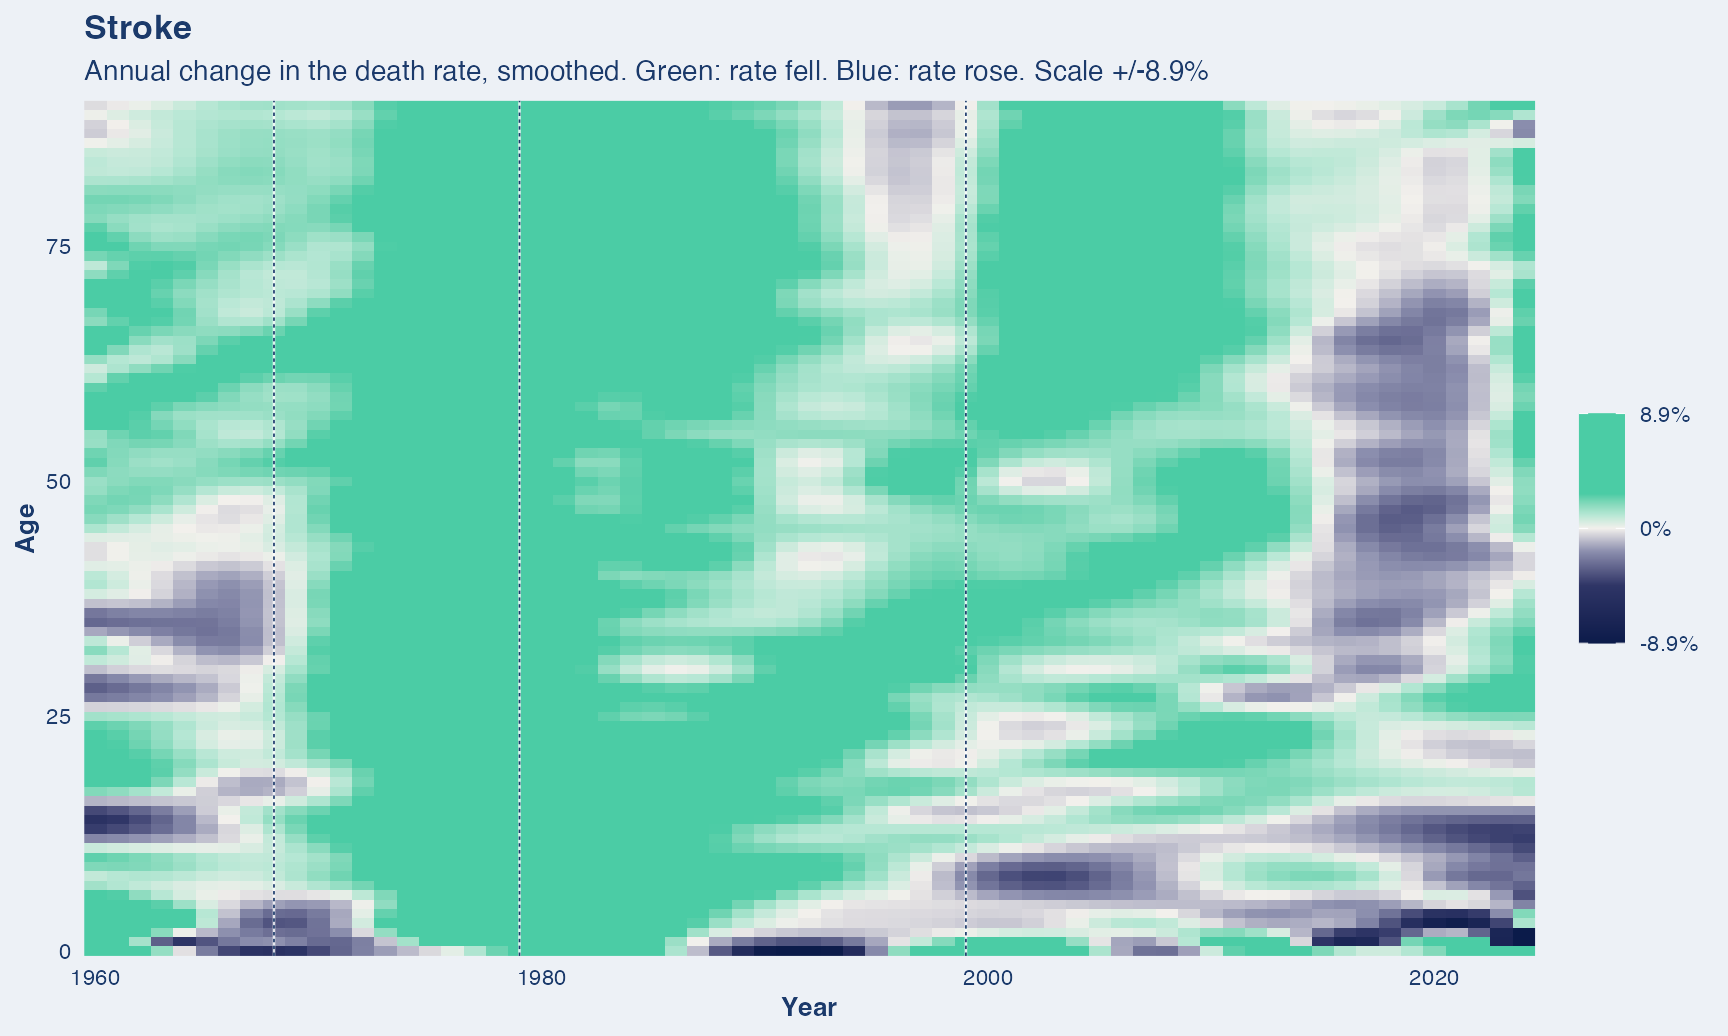
What this covers. Cerebrovascular disease: bleeding or clotting in the blood vessels of the brain.
Years shown. 1959 to 2024. Crosswalk checked at the ICD-7 to ICD-8 boundary: this cause holds the same share of all deaths either side of 1968, to about a tenth of a point, so the mapping does not jump there.
Dashed vertical lines mark ICD revision boundaries (1968, 1979, 1999). A step at one of these is the classification changing, not necessarily mortality.
One source throughout. Deaths for every year come from the NBER mirror of the NCHS Multiple Cause-of-Death files, so nothing in this series is a change of data source.
Injury and external causes
External causes
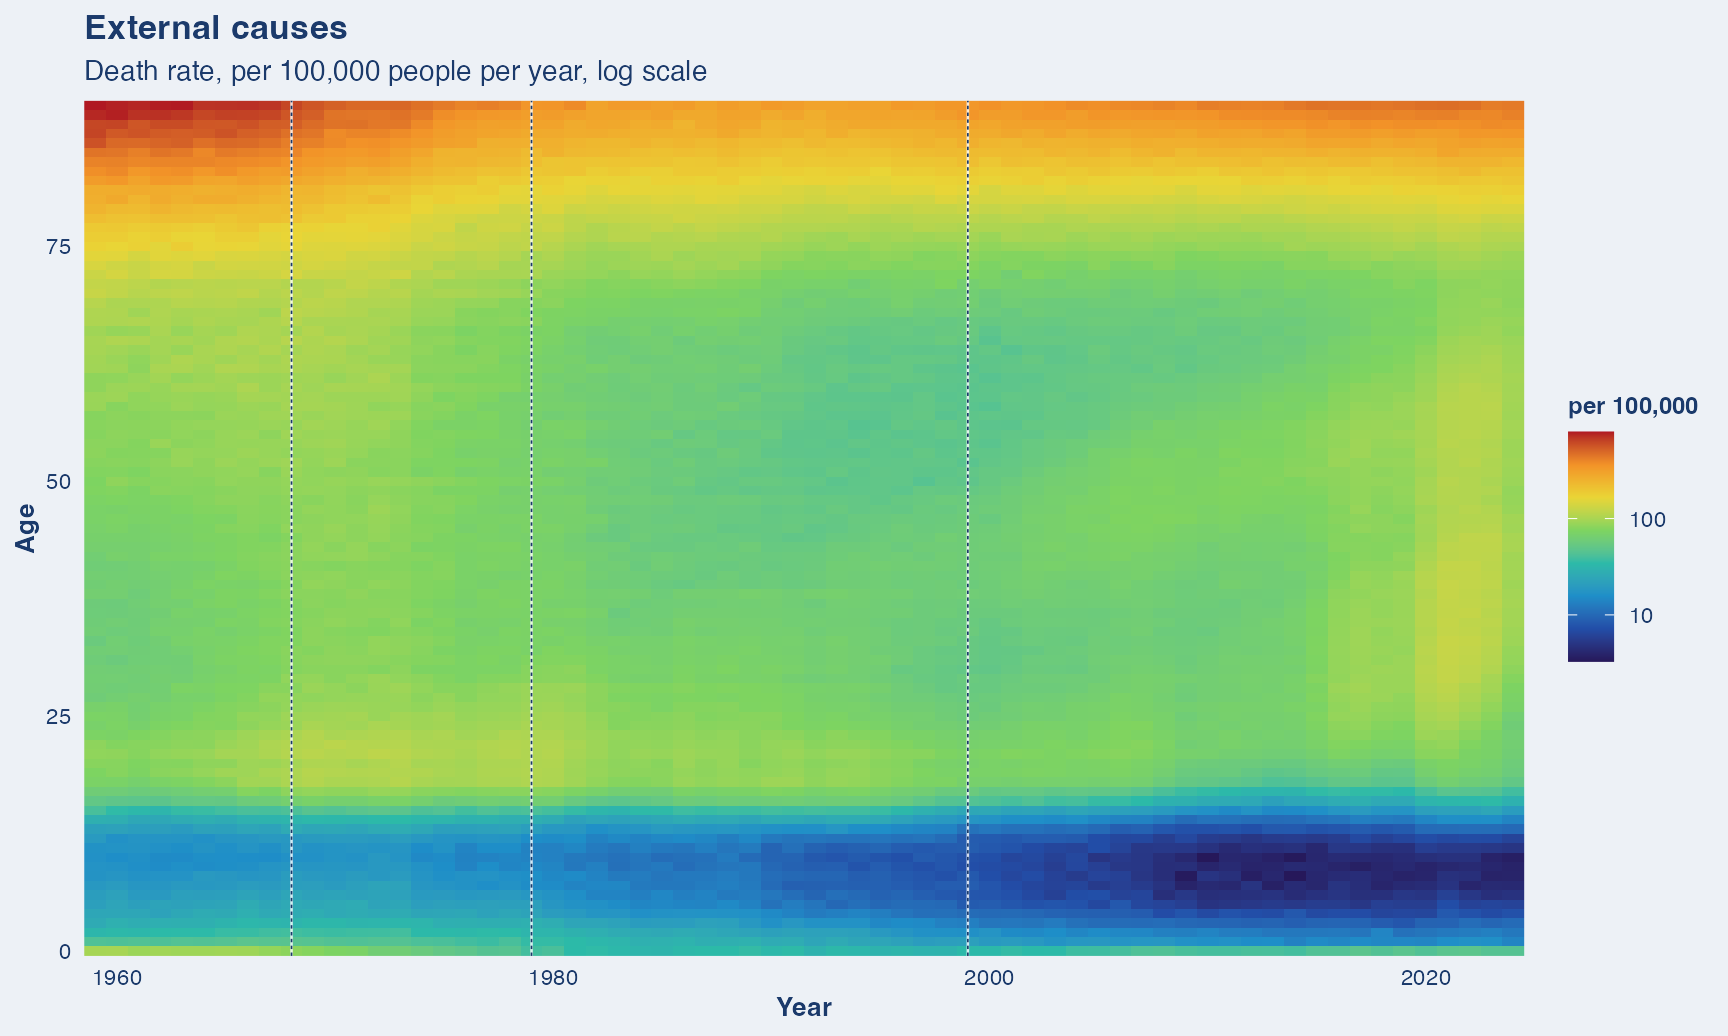
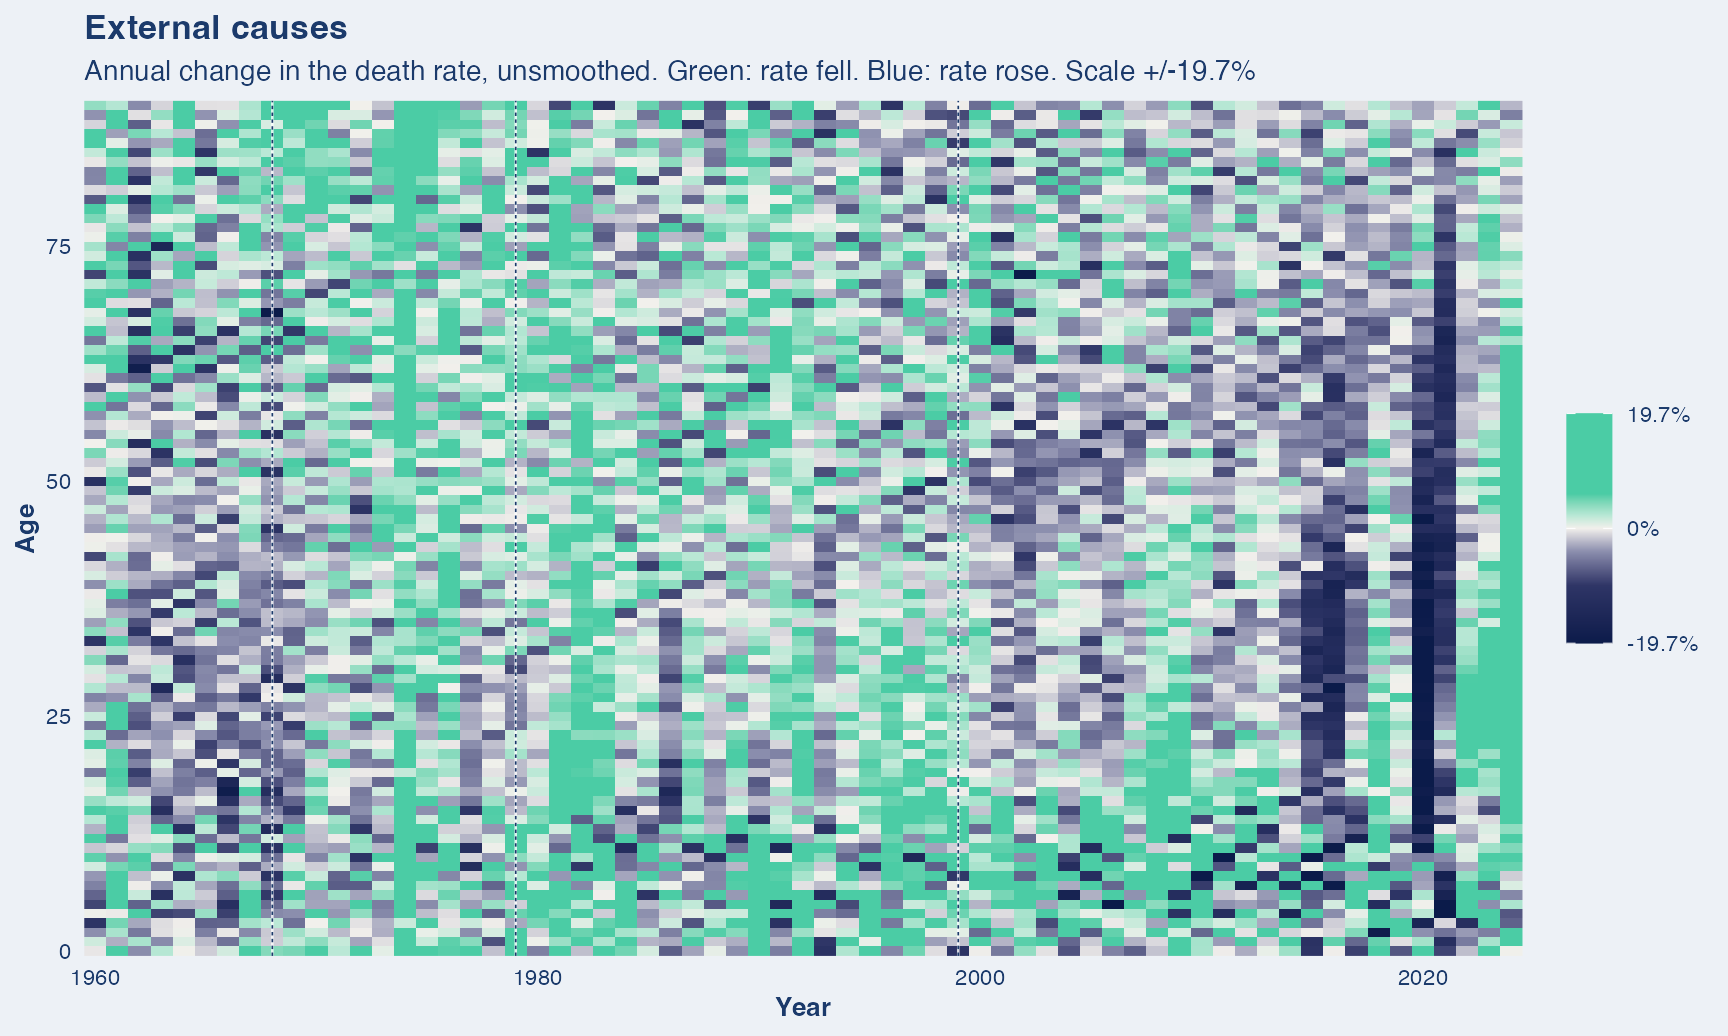
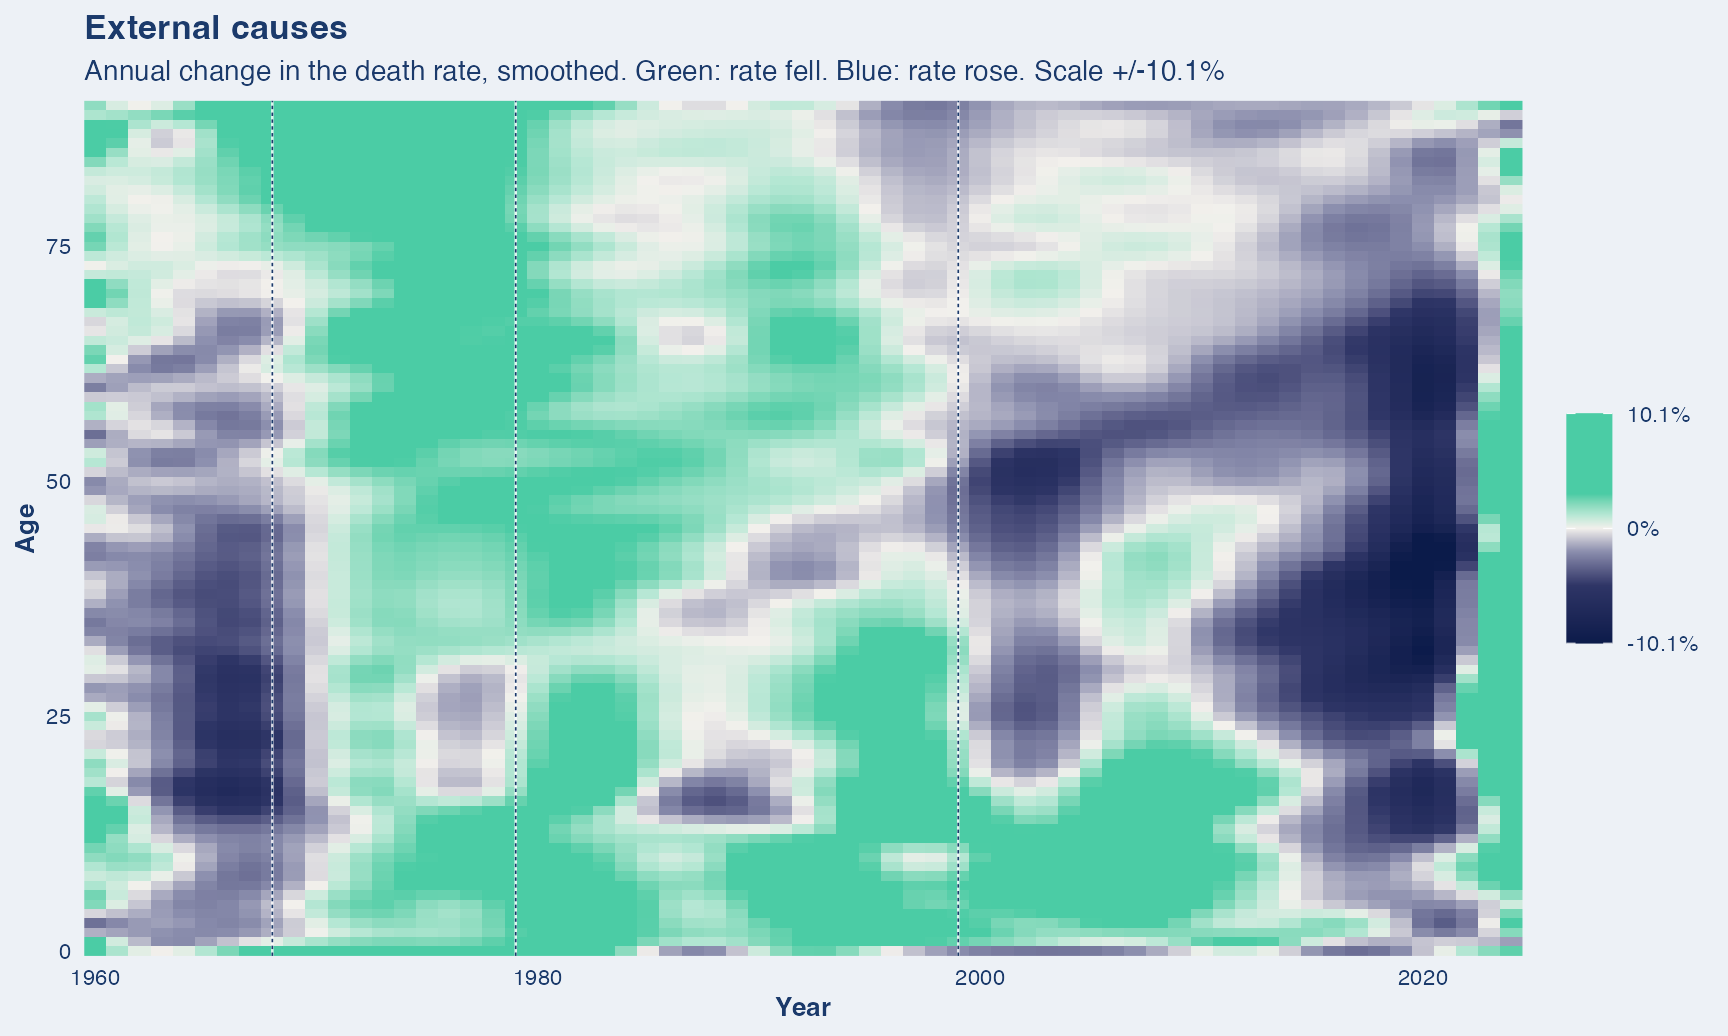
What this covers. Everything that is not disease: accidents, suicide, homicide, poisoning, drowning, falls. The parent group for the six that follow.
Years shown. 1959 to 2024. ICD-7 (1959-1967) numbers the external-cause blocks differently from later revisions. Handled in the crosswalk and checked against published 1959 counts.
Dashed vertical lines mark ICD revision boundaries (1968, 1979, 1999). A step at one of these is the classification changing, not necessarily mortality.
One source throughout. Deaths for every year come from the NBER mirror of the NCHS Multiple Cause-of-Death files, so nothing in this series is a change of data source.
Motor vehicle
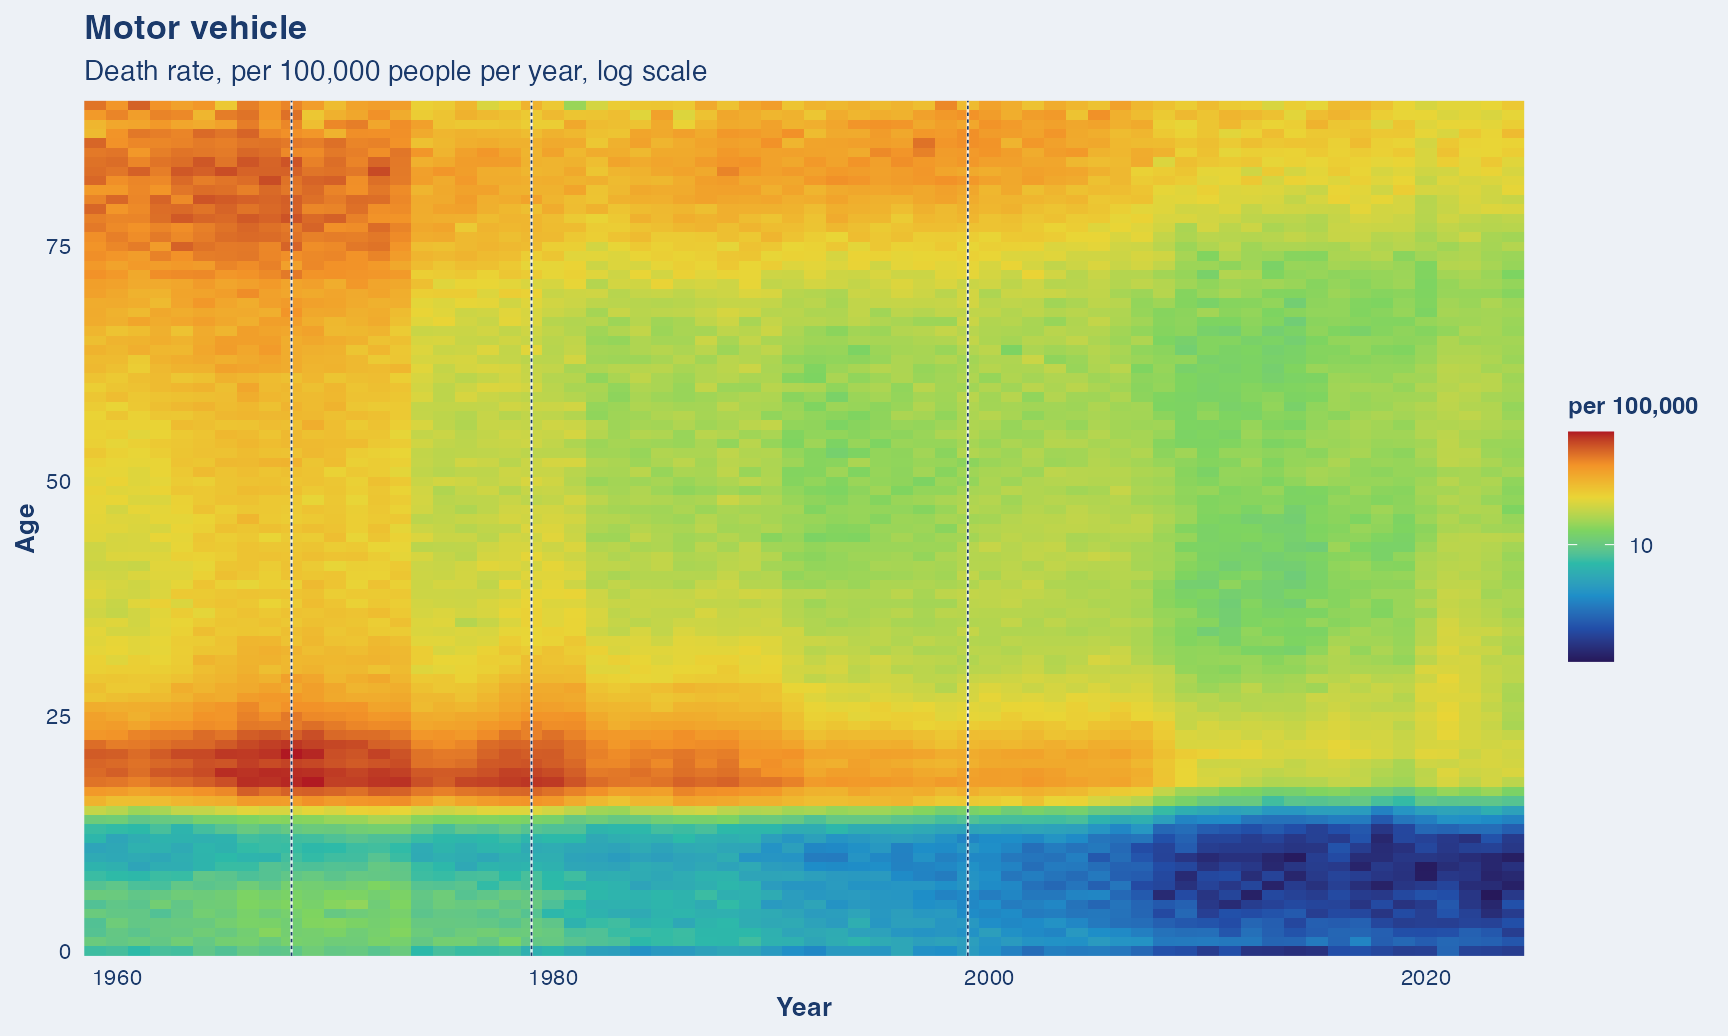
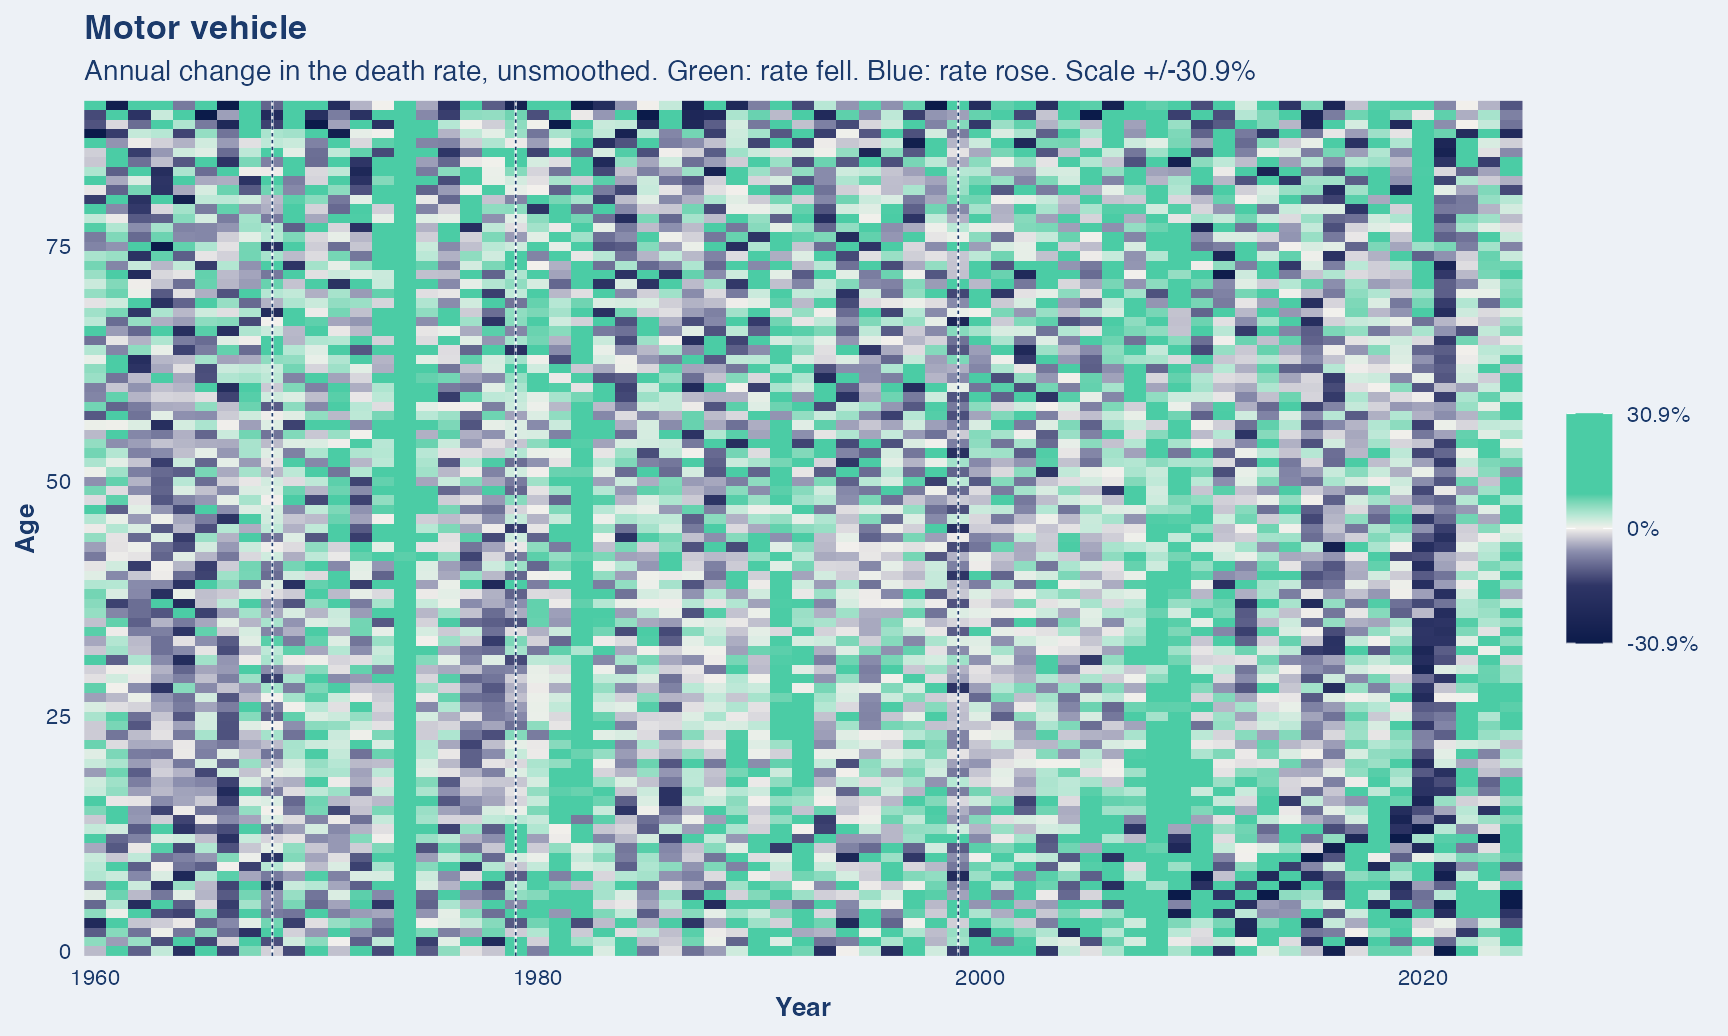
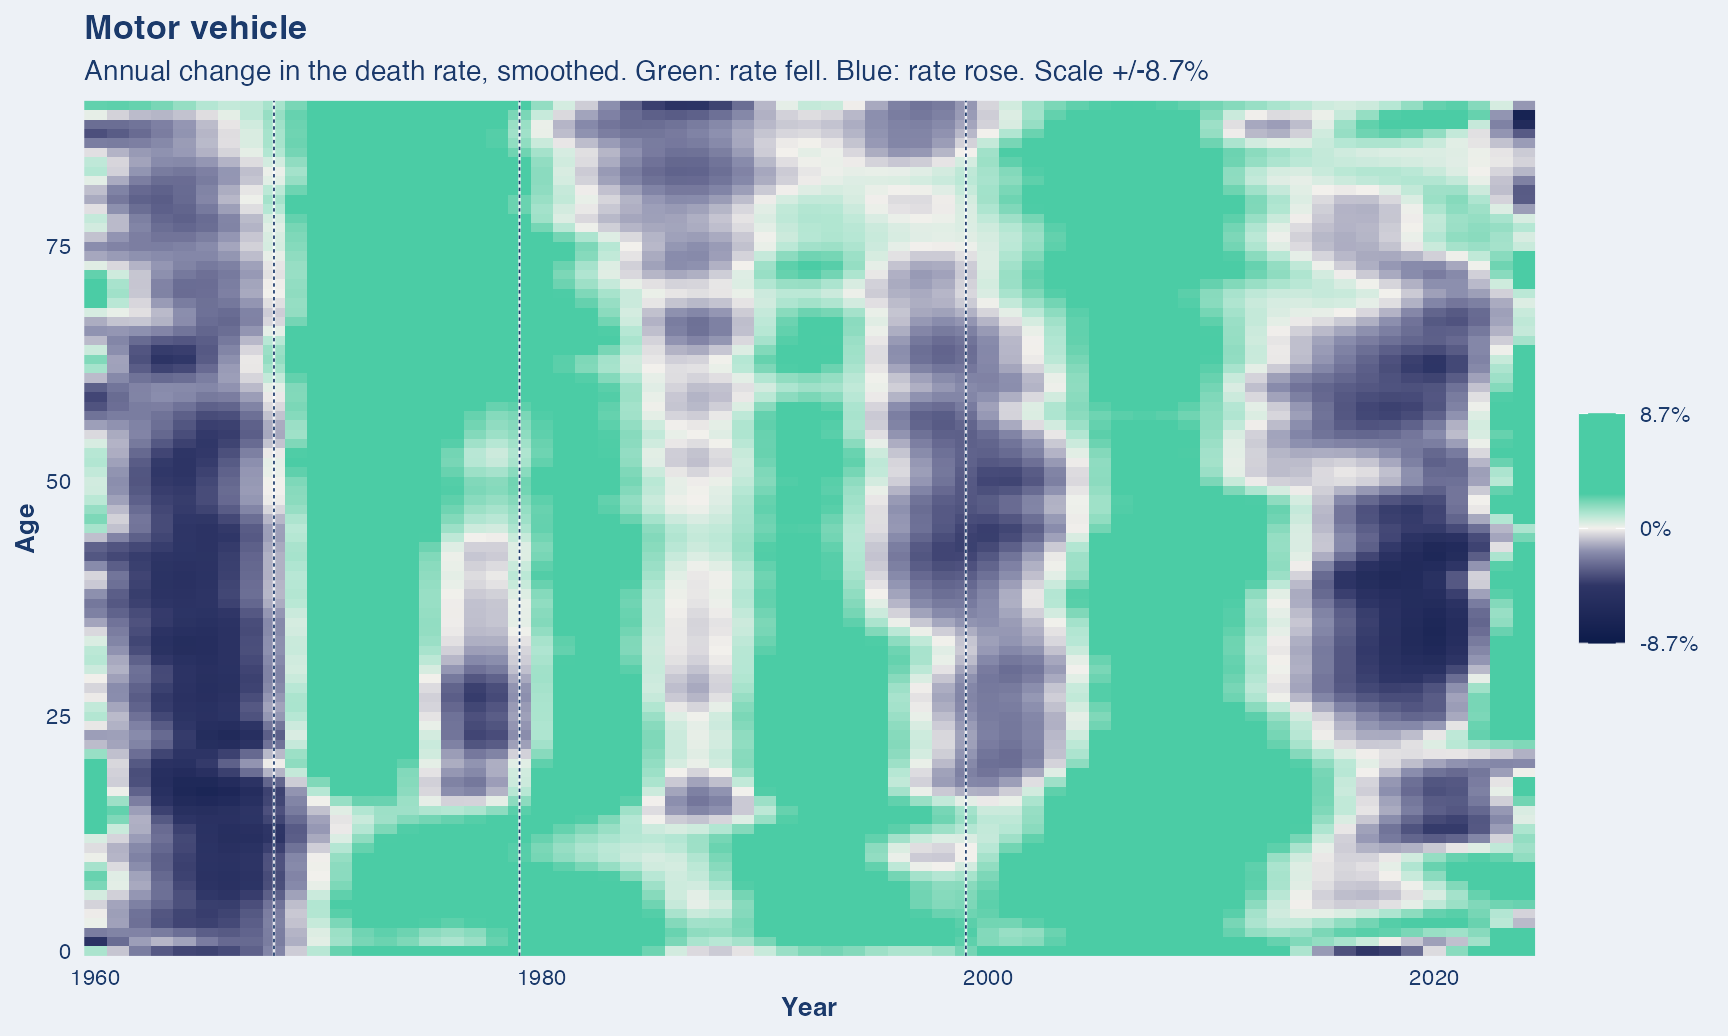
What this covers. Deaths in road traffic crashes, including drivers, passengers, pedestrians and cyclists.
Years shown. 1959 to 2024. Checked against published national counts for 1959 and 1979.
Dashed vertical lines mark ICD revision boundaries (1968, 1979, 1999). A step at one of these is the classification changing, not necessarily mortality.
One source throughout. Deaths for every year come from the NBER mirror of the NCHS Multiple Cause-of-Death files, so nothing in this series is a change of data source.
Turns in this series, and what they line up with. These are timing coincidences worth knowing, not explanations: nothing here can establish cause.
- 1974, down 16% (55,483 to 46,383), the largest single-year fall in the series. The national 55 mph speed limit took effect on 2 January 1974 under the Emergency Highway Energy Conservation Act. It arrived in the middle of the oil crisis, so less driving and slower driving happen in the same year and this data cannot separate them.
- 1981 to 1983, down 13%, steepest in 1982 at -11.3%. This spans the 1981-82 recession. The Surface Transportation Assistance Act was signed in January 1983, after most of the fall had already happened.
- 1989 to 1992, down 16%, and concentrated in the young. Deaths under 25 fall from 16,428 to 13,229, a 20% drop against 12% for everyone else. The federal minimum drinking age of 21 was enacted in 1984 and in force in every state by 1988, which fits a decline specific to young drivers. ISTEA passed in December 1991, near the end of this fall rather than at its start.
- 1984 is often given as a seatbelt milestone, but there has never been a federal law requiring adults to wear seatbelts. New York’s law, effective 1 December 1984, was the first state law of its kind and other states followed over the next three decades. Nothing visible happens here in 1984 or 1985; 1984 is up 4.1%.
Suicide
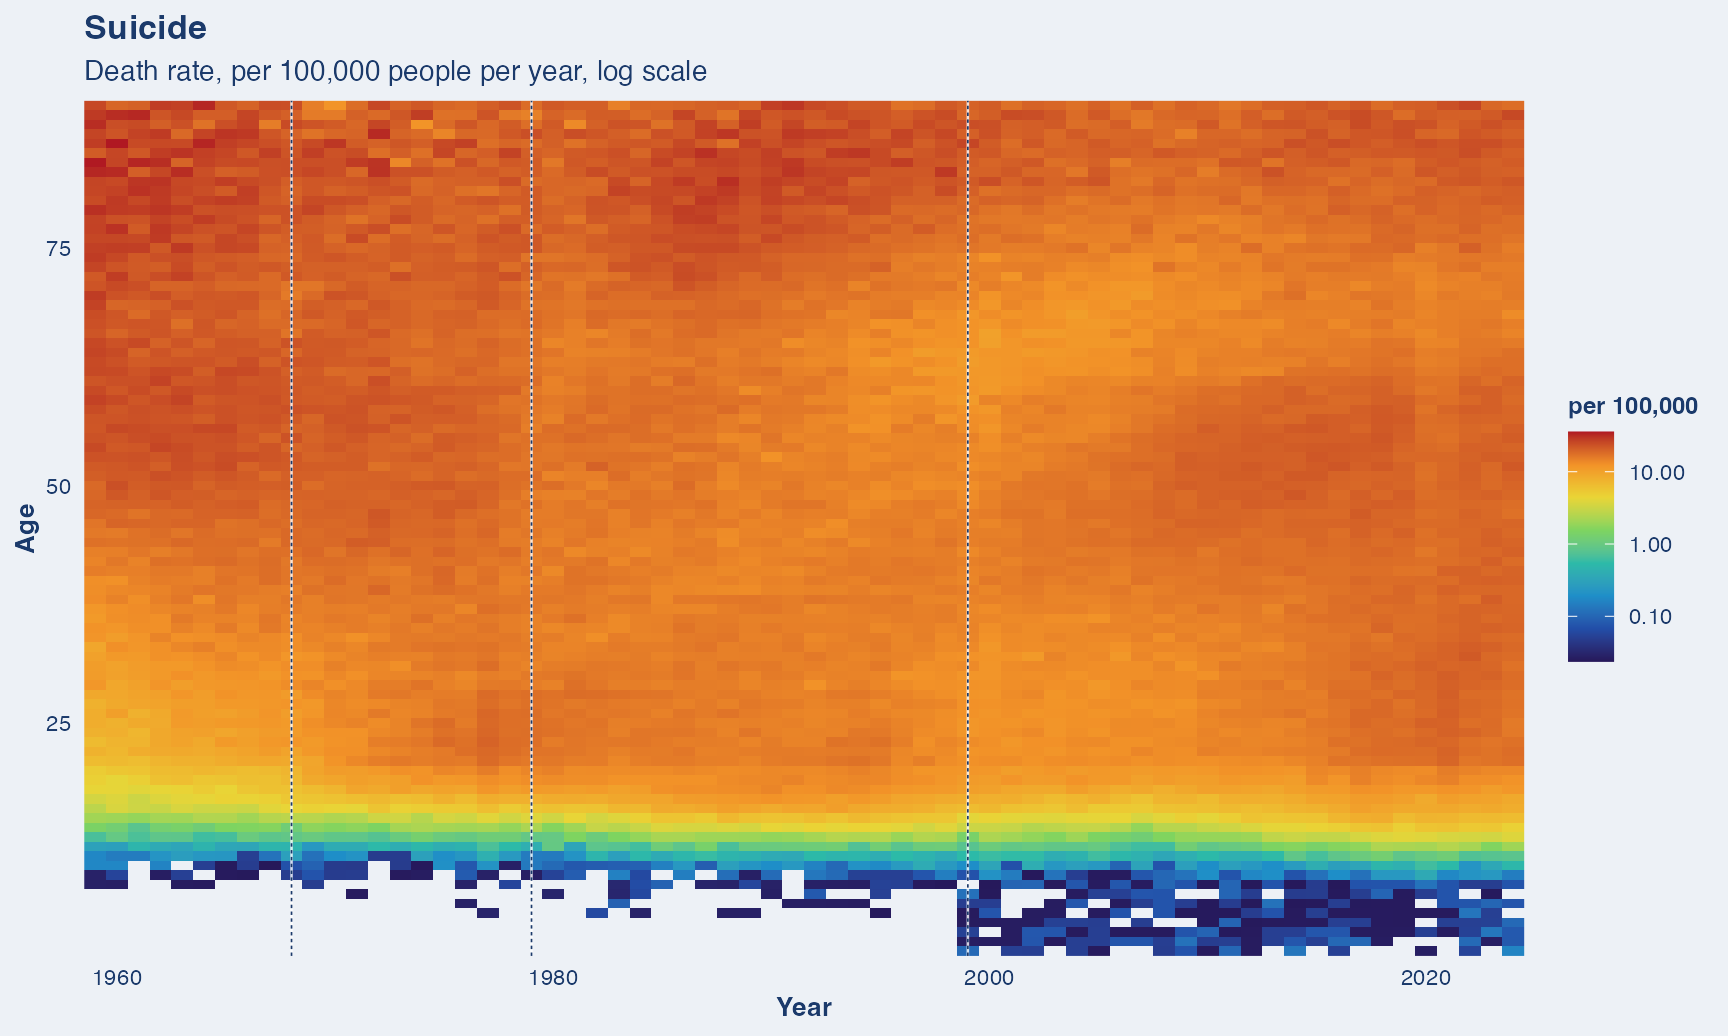
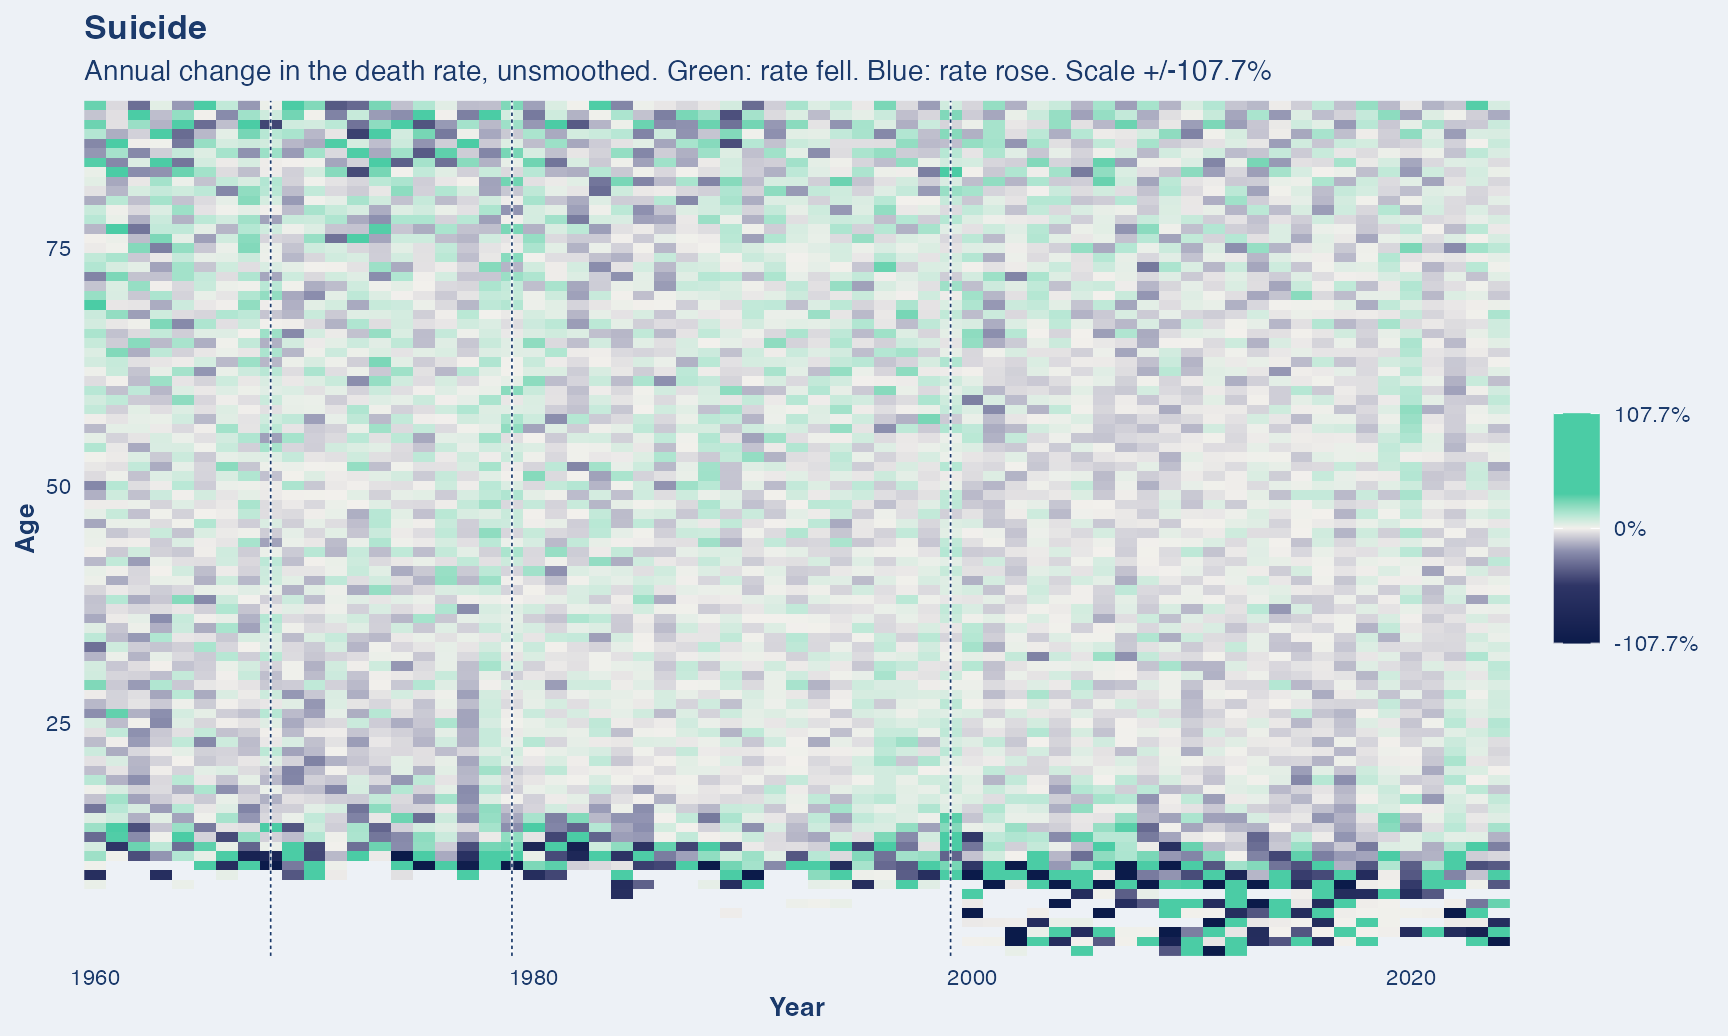
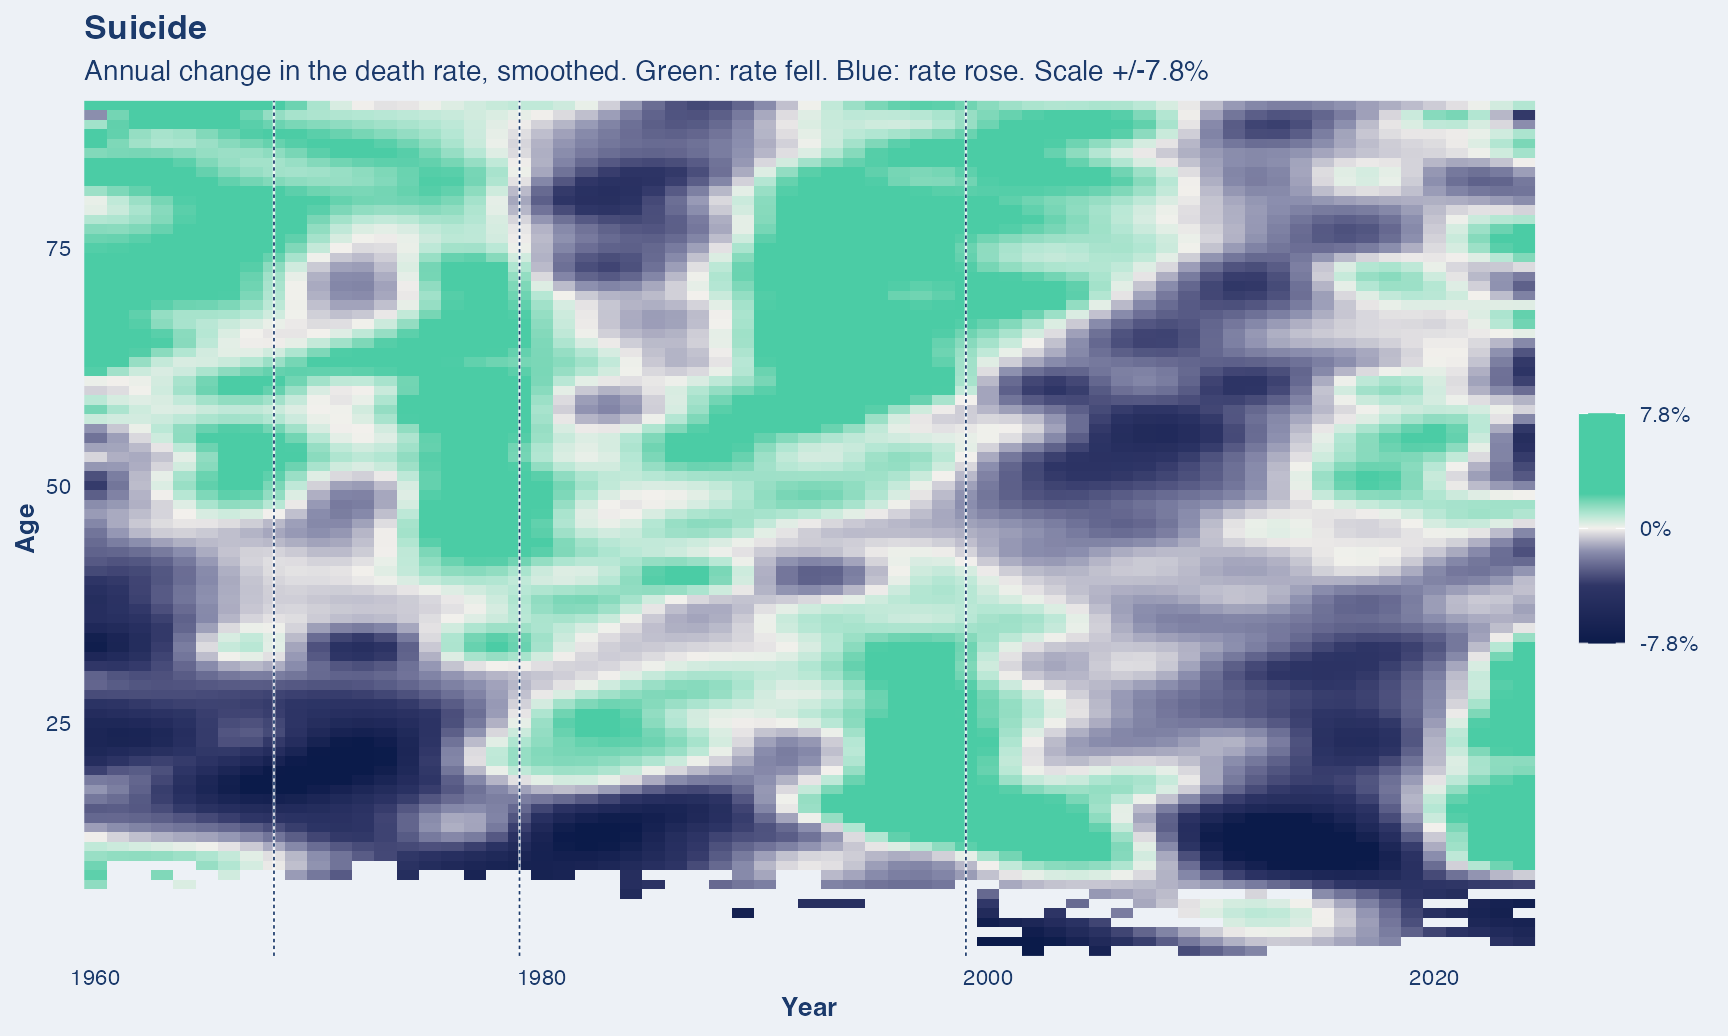
What this covers. Intentional self-harm, by any method.
Years shown. 1959 to 2024. Checked against published national counts for 1959, 1968 and 1979.
Dashed vertical lines mark ICD revision boundaries (1968, 1979, 1999). A step at one of these is the classification changing, not necessarily mortality.
One source throughout. Deaths for every year come from the NBER mirror of the NCHS Multiple Cause-of-Death files, so nothing in this series is a change of data source.
Homicide
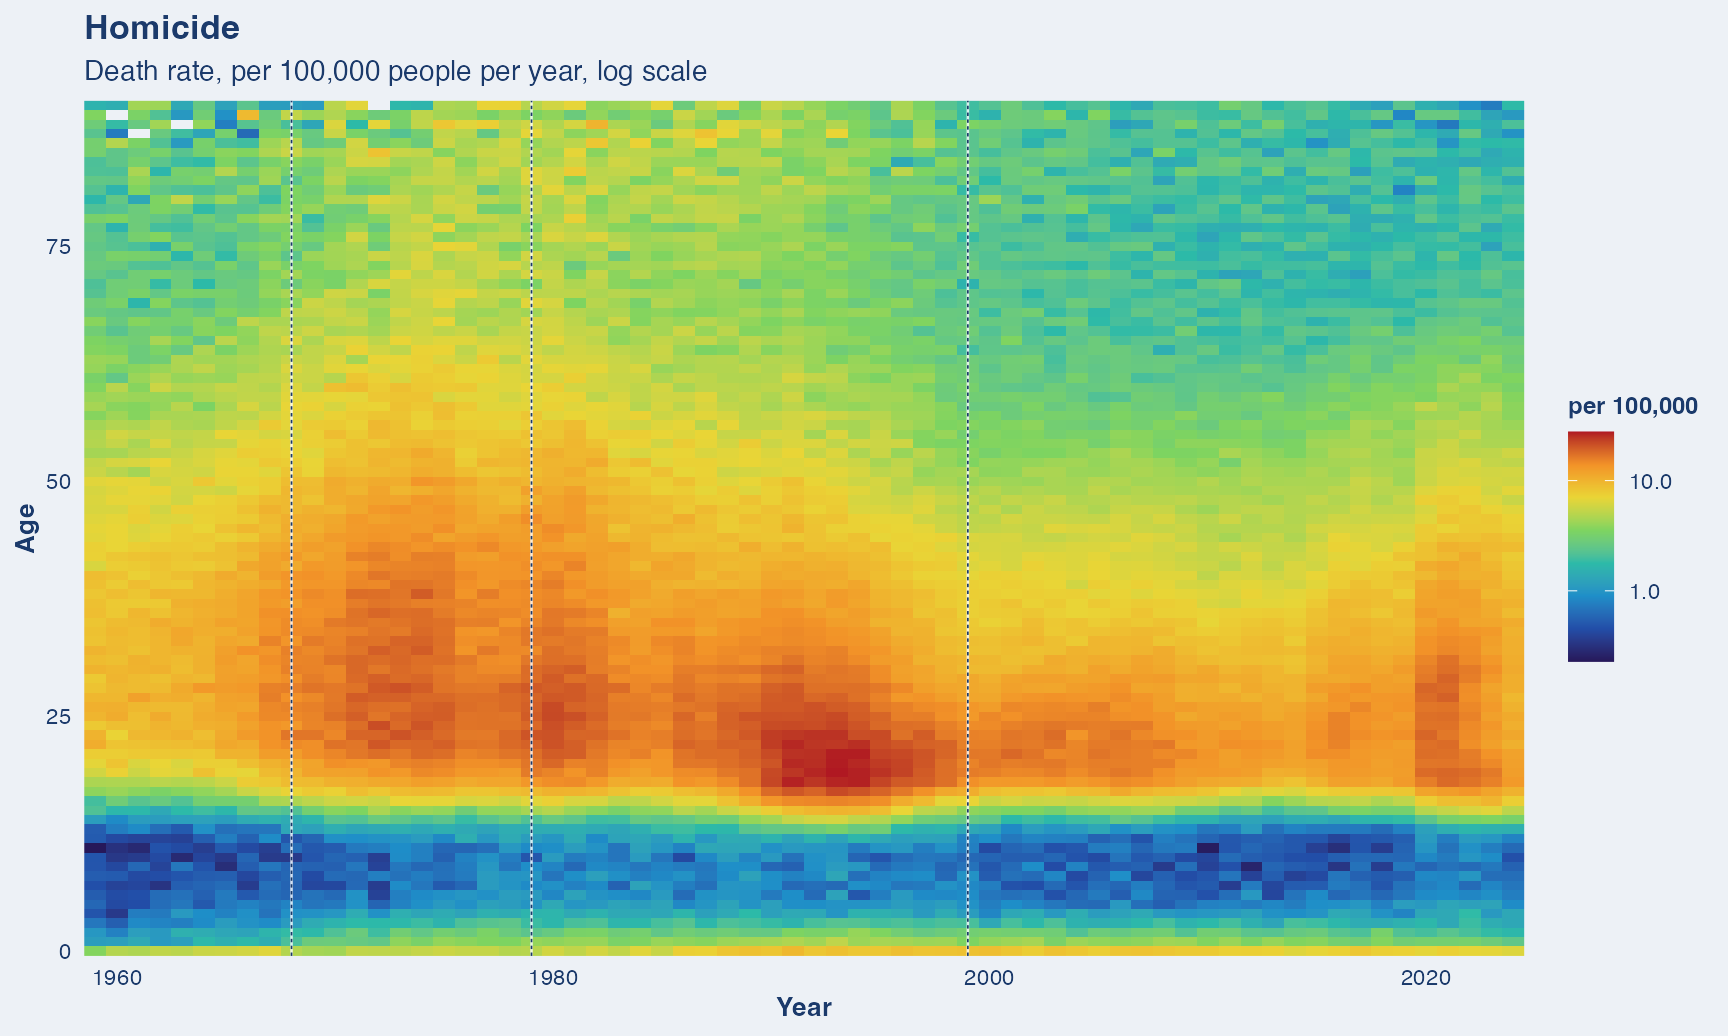
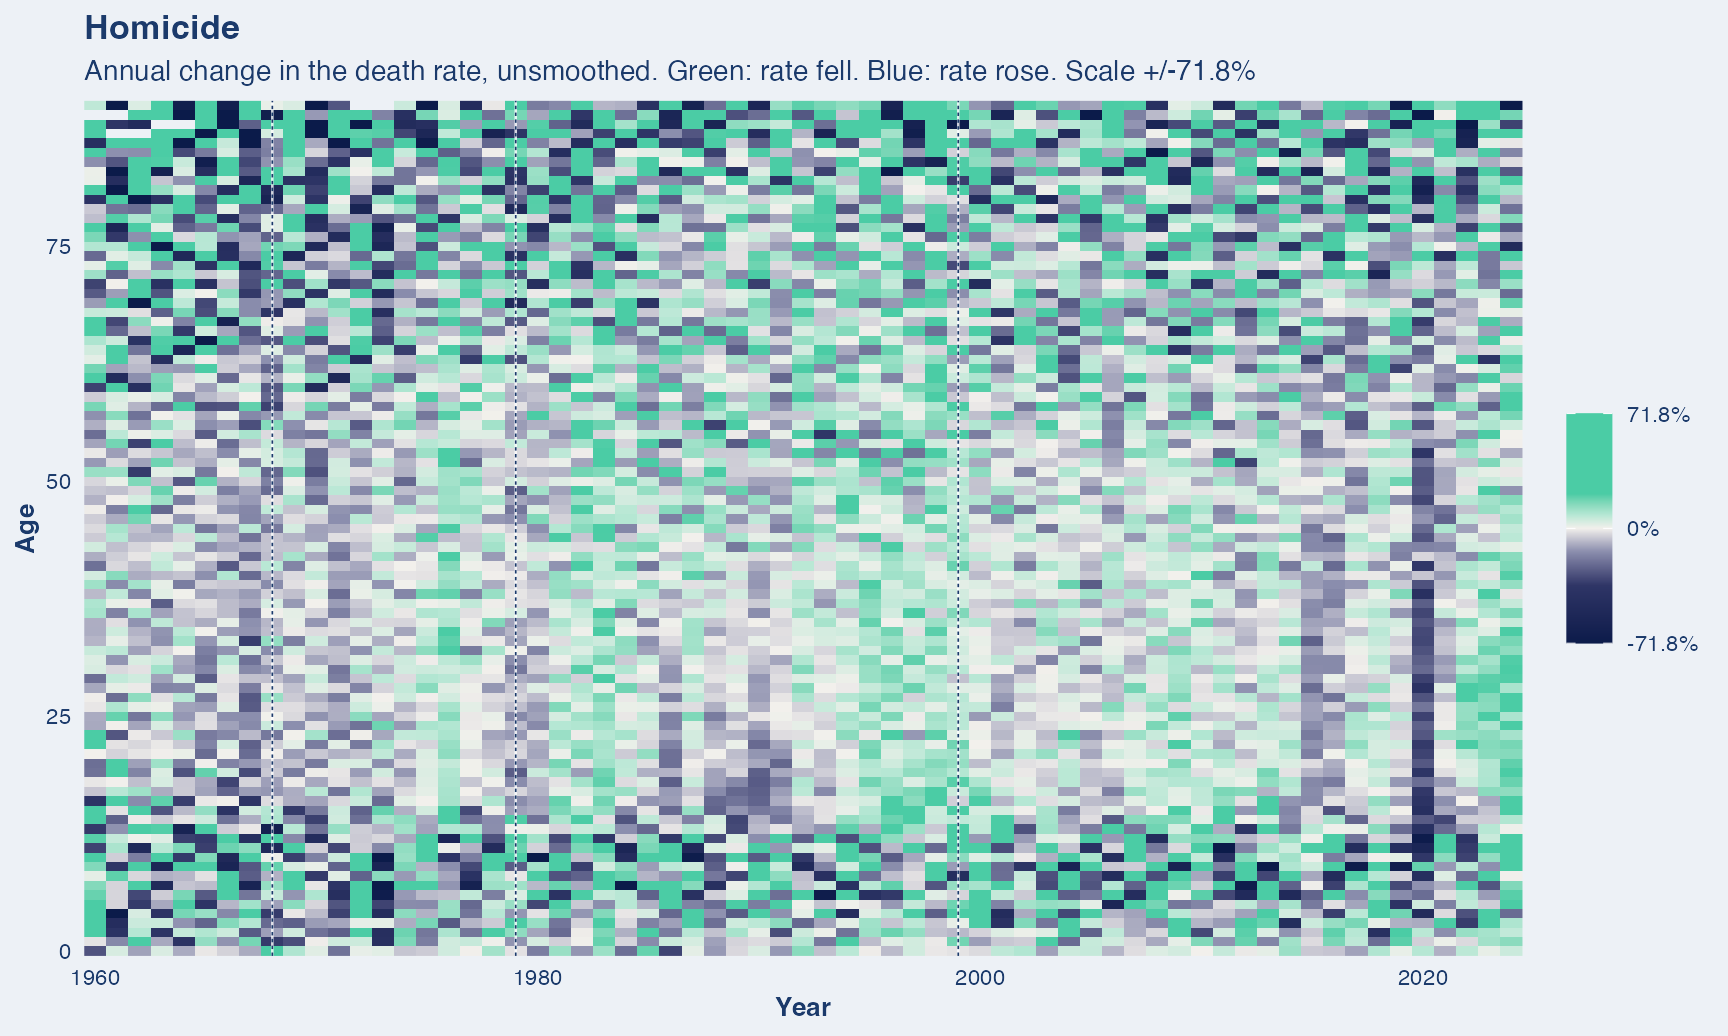
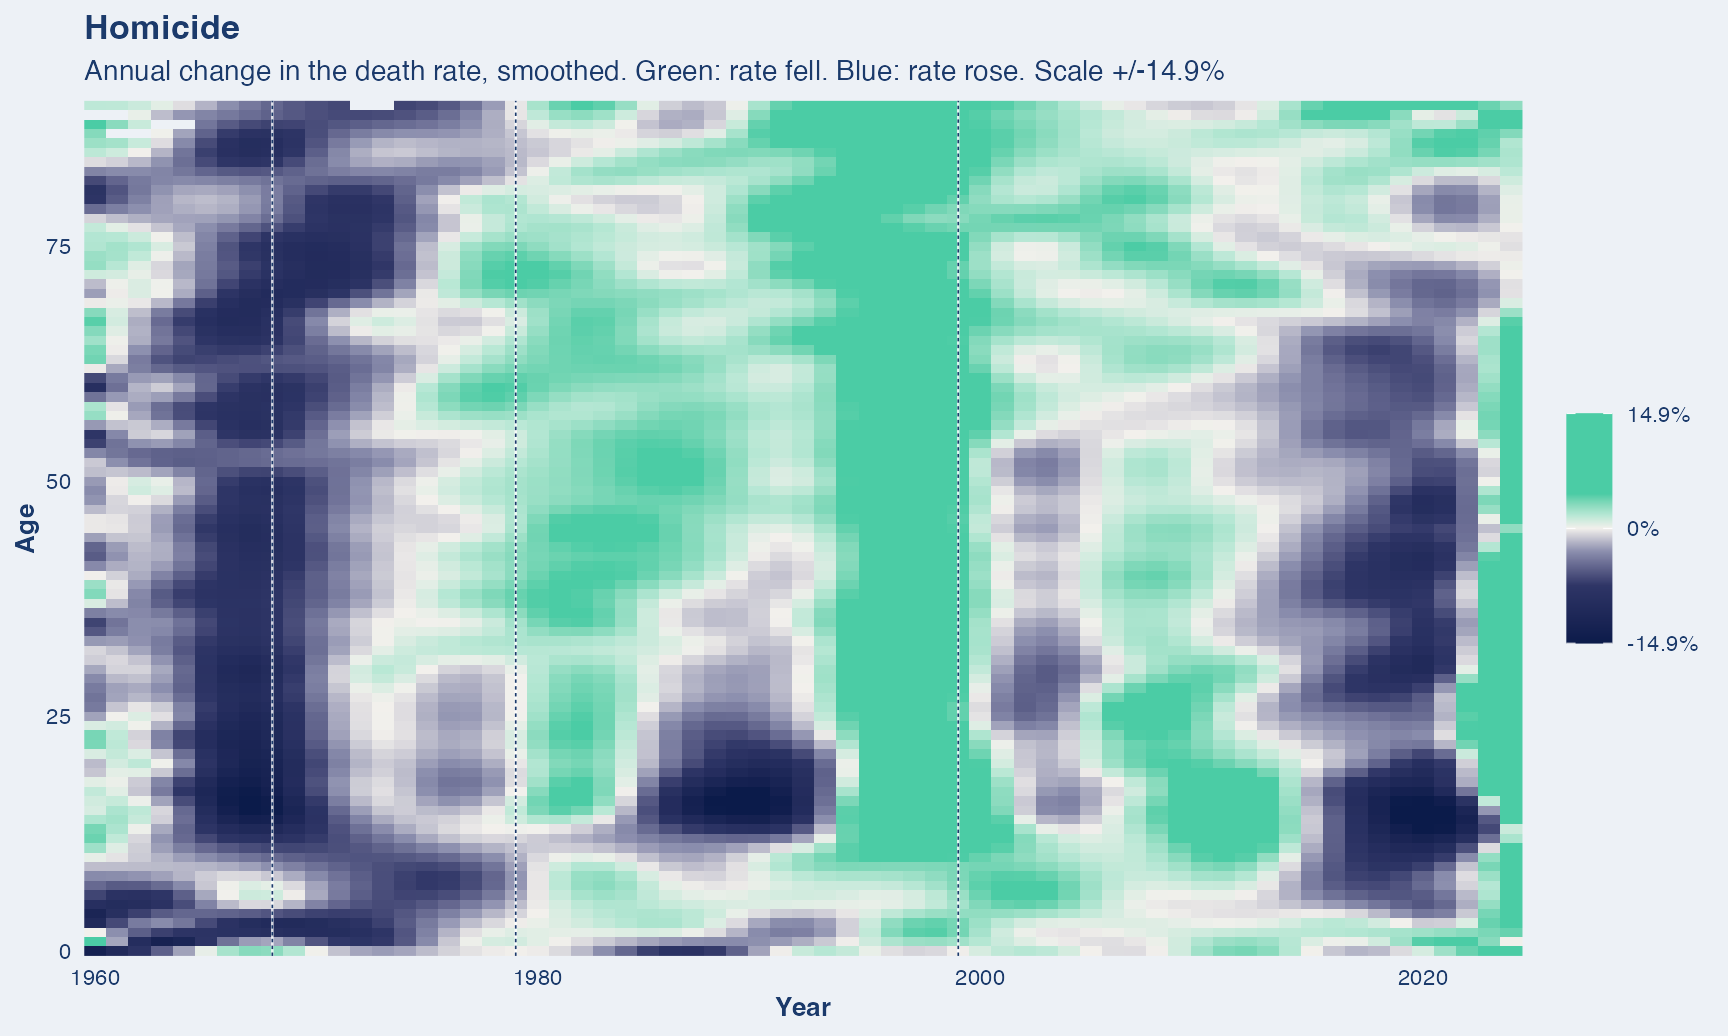
What this covers. Assault by another person, by any method.
Years shown. 1959 to 2024. Checked against published counts; 1979 comes out about 2% low, most likely a definitional difference rather than a parsing error.
Dashed vertical lines mark ICD revision boundaries (1968, 1979, 1999). A step at one of these is the classification changing, not necessarily mortality.
One source throughout. Deaths for every year come from the NBER mirror of the NCHS Multiple Cause-of-Death files, so nothing in this series is a change of data source.
Drug poisoning
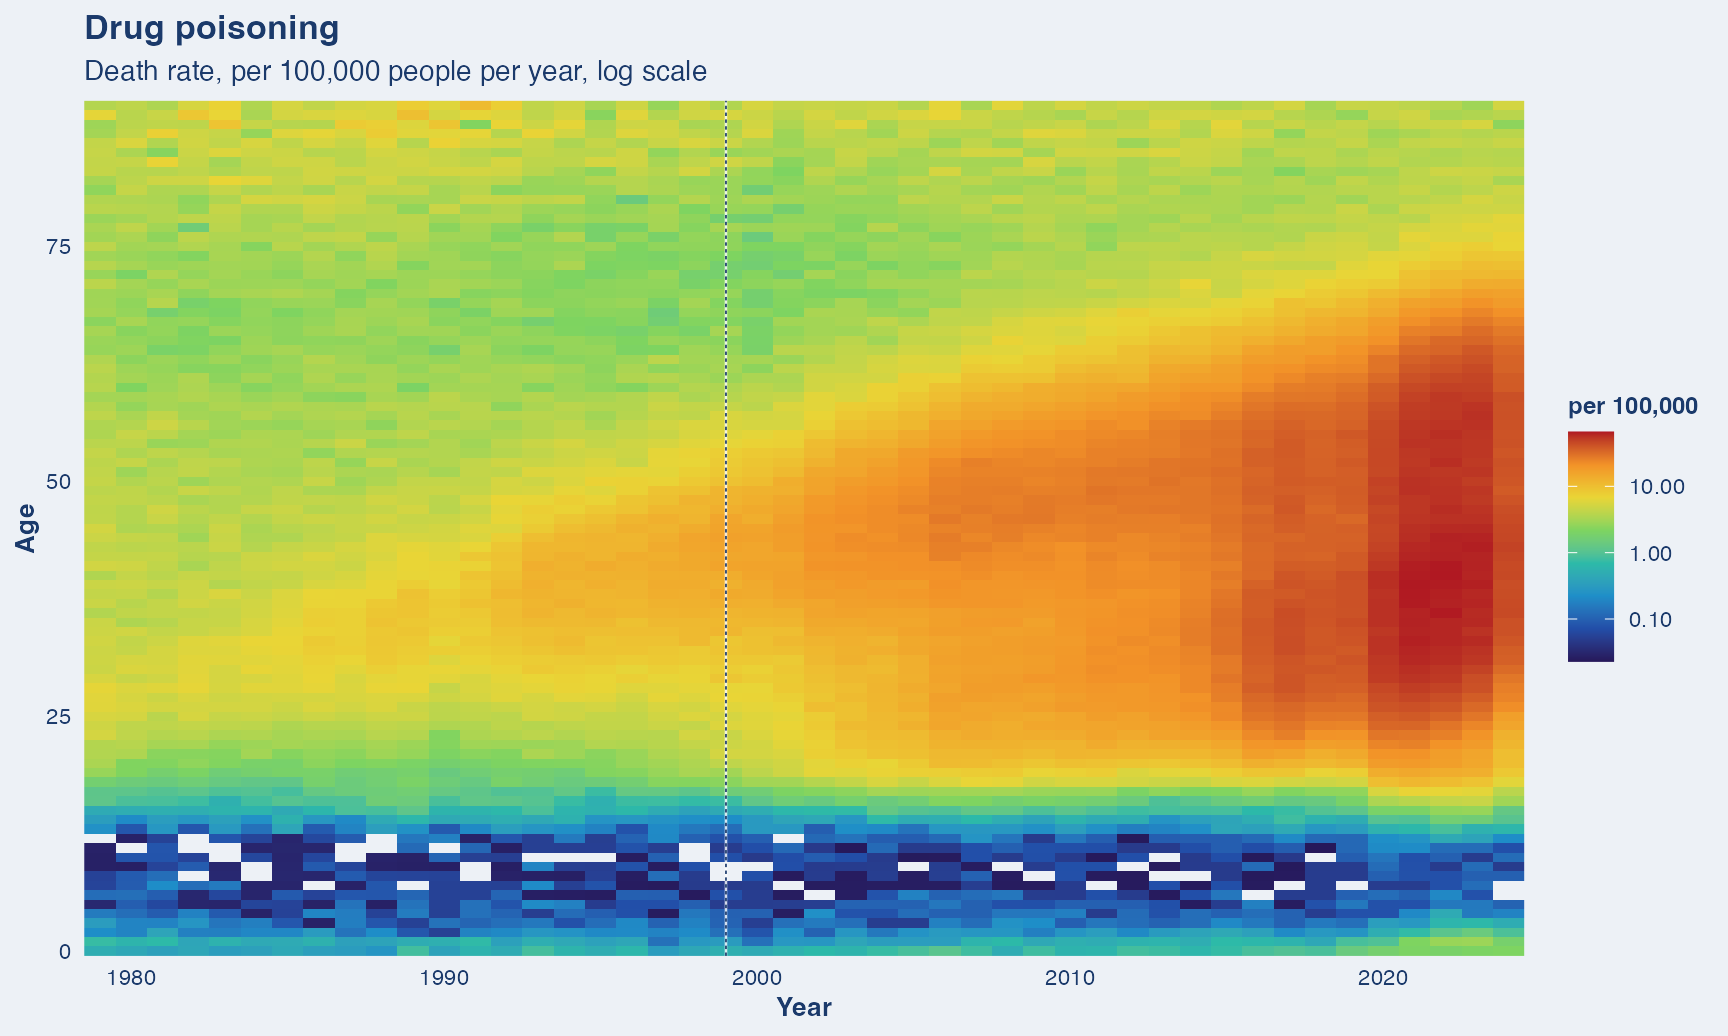
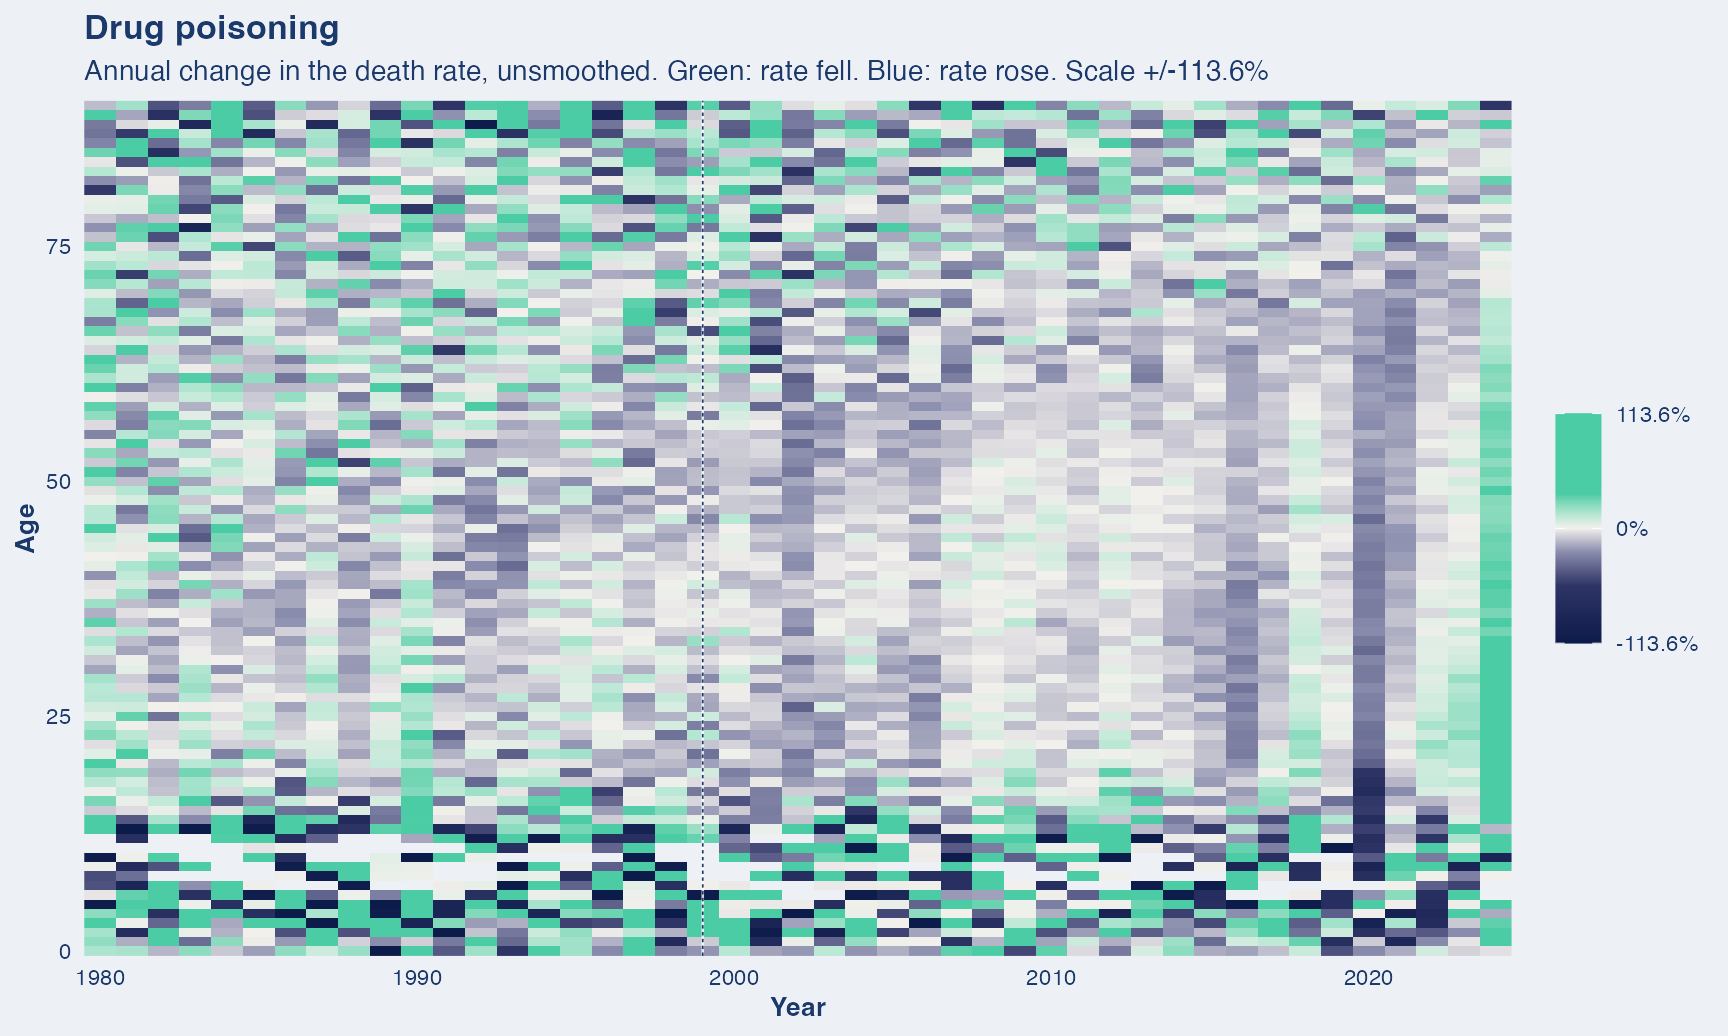
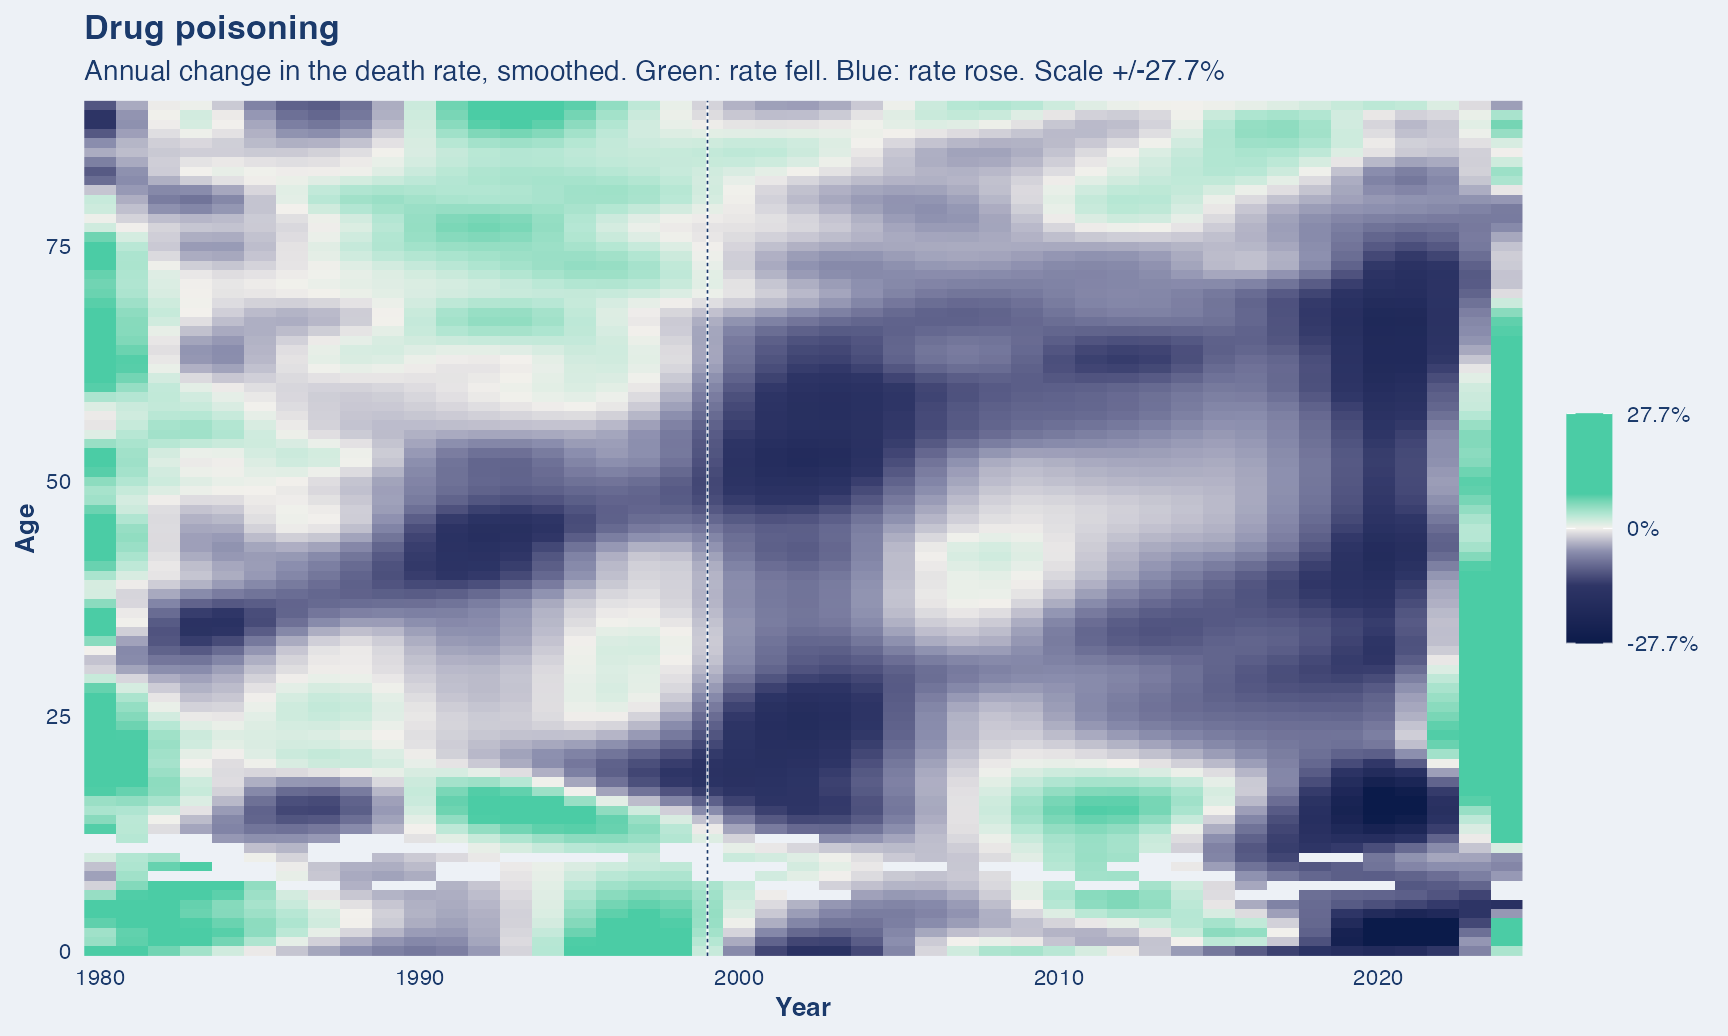
What this covers. Overdose deaths of any intent: accidental, suicide, homicide or undetermined. Legal and illegal drugs alike.
Years shown. 1979 to 2024. Needs sub-codes that only exist from ICD-9 (1979) onward, so the series starts there.
Dashed vertical lines mark ICD revision boundaries (1999). A step at one of these is the classification changing, not necessarily mortality.
One source throughout. Deaths for every year come from the NBER mirror of the NCHS Multiple Cause-of-Death files, so nothing in this series is a change of data source.
Firearms
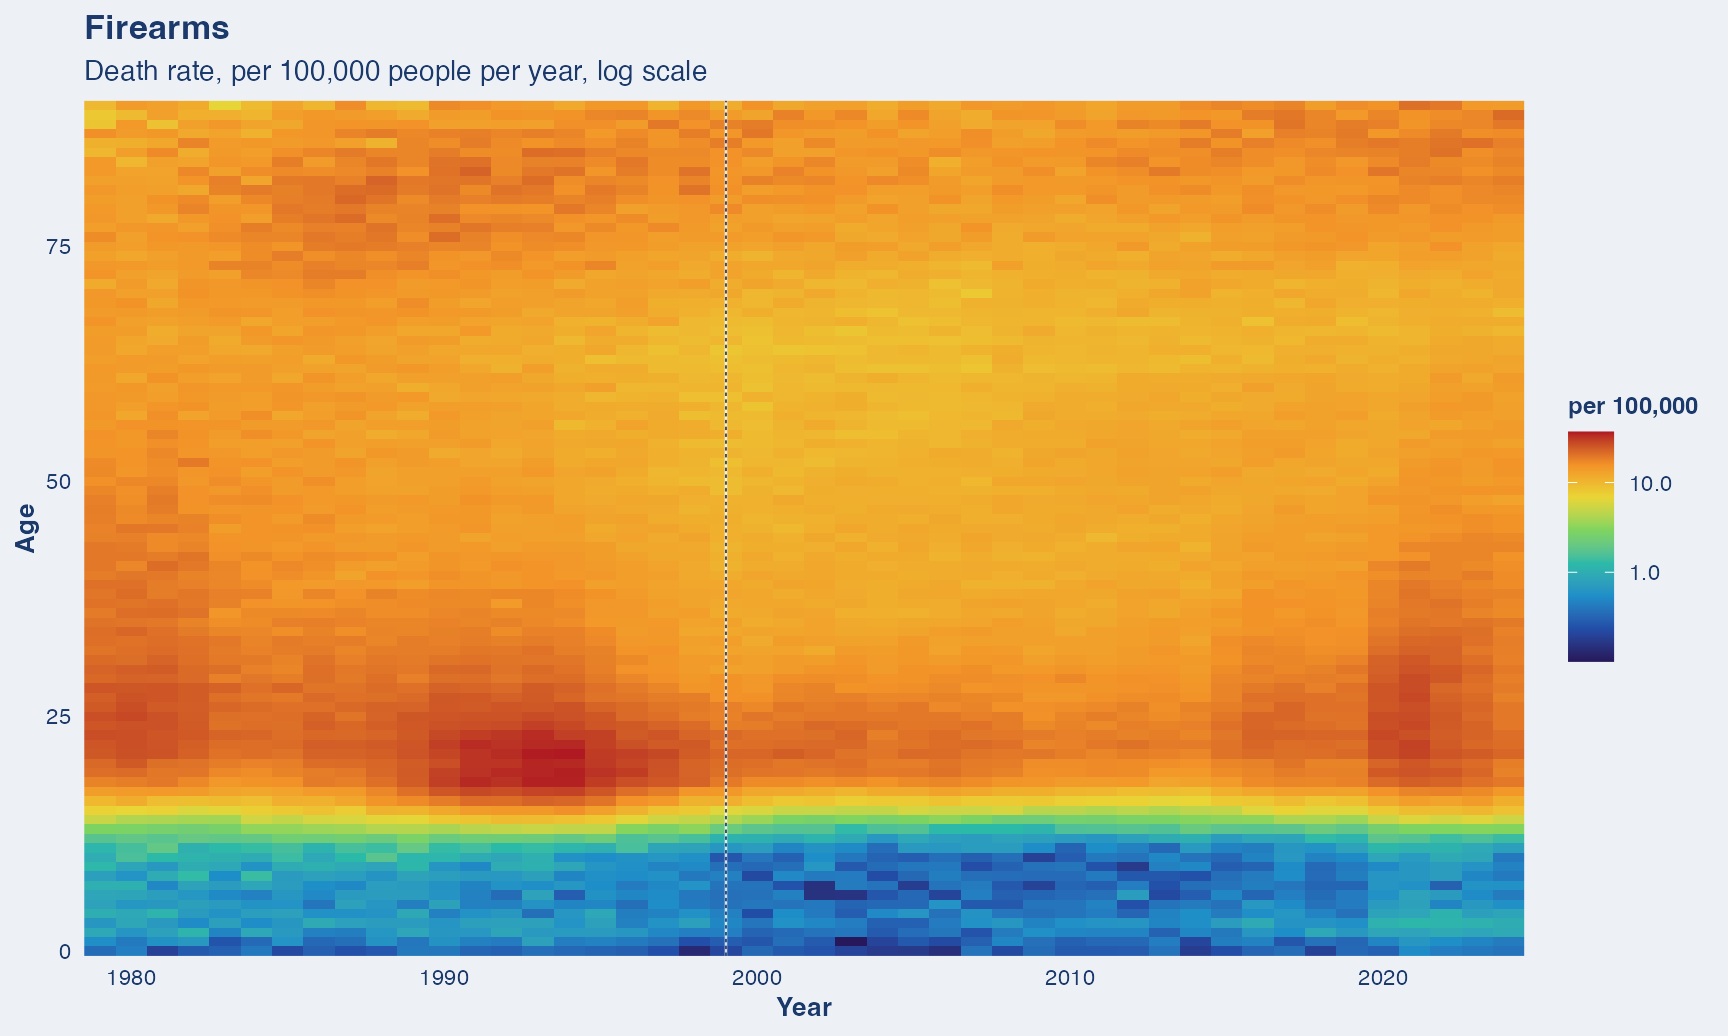
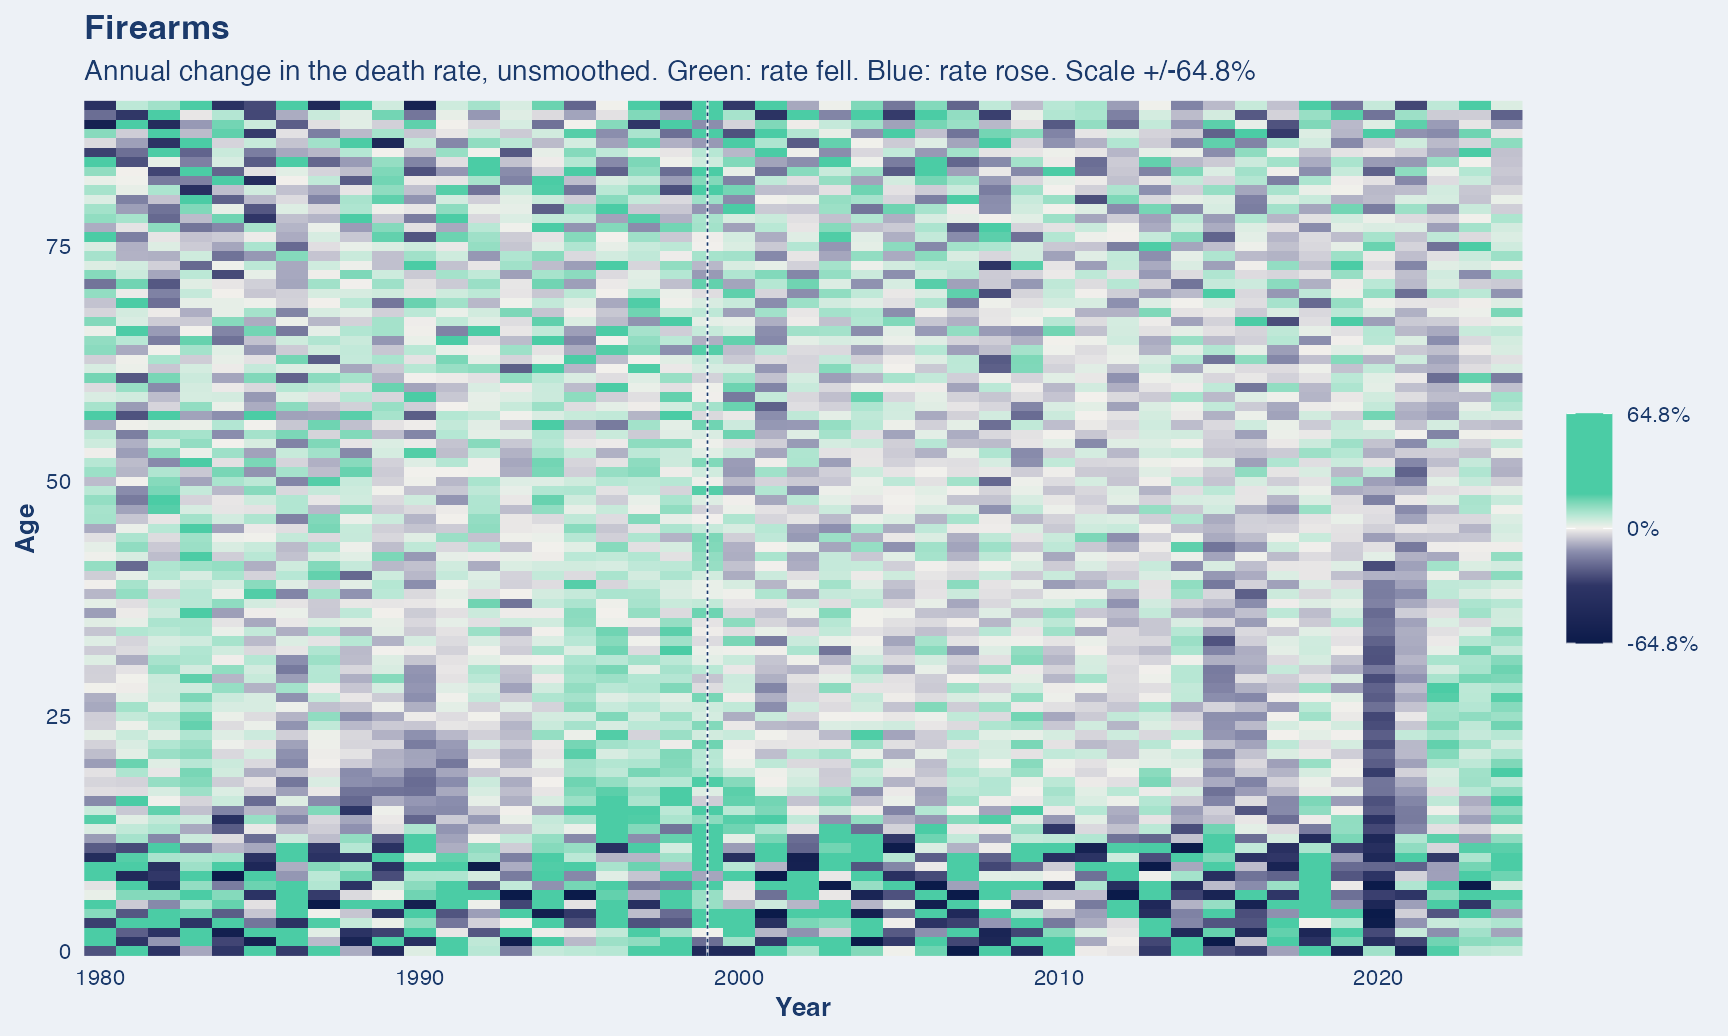
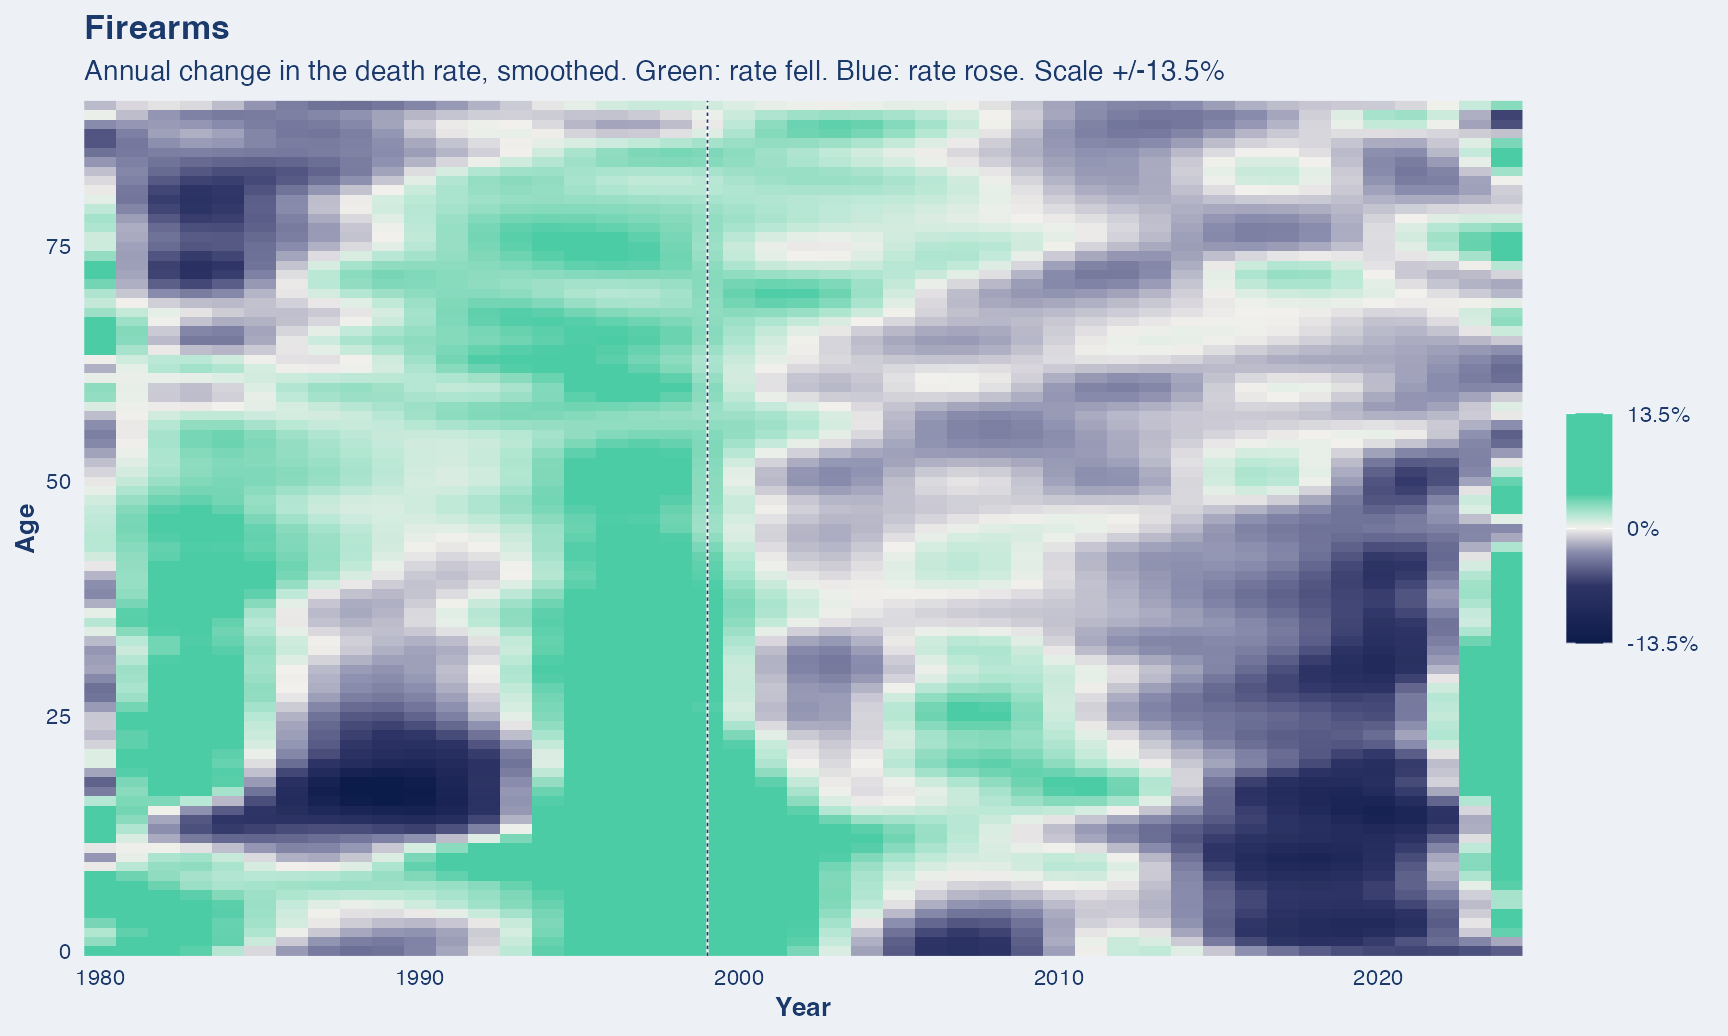
What this covers. Deaths by gunshot of any intent, cutting across suicide, homicide and accident rather than sitting inside any one of them.
Years shown. 1979 to 2024. Needs sub-codes that only exist from ICD-9 (1979) onward, so the series starts there.
Dashed vertical lines mark ICD revision boundaries (1999). A step at one of these is the classification changing, not necessarily mortality.
One source throughout. Deaths for every year come from the NBER mirror of the NCHS Multiple Cause-of-Death files, so nothing in this series is a change of data source.
Infectious disease
Influenza & pneumonia
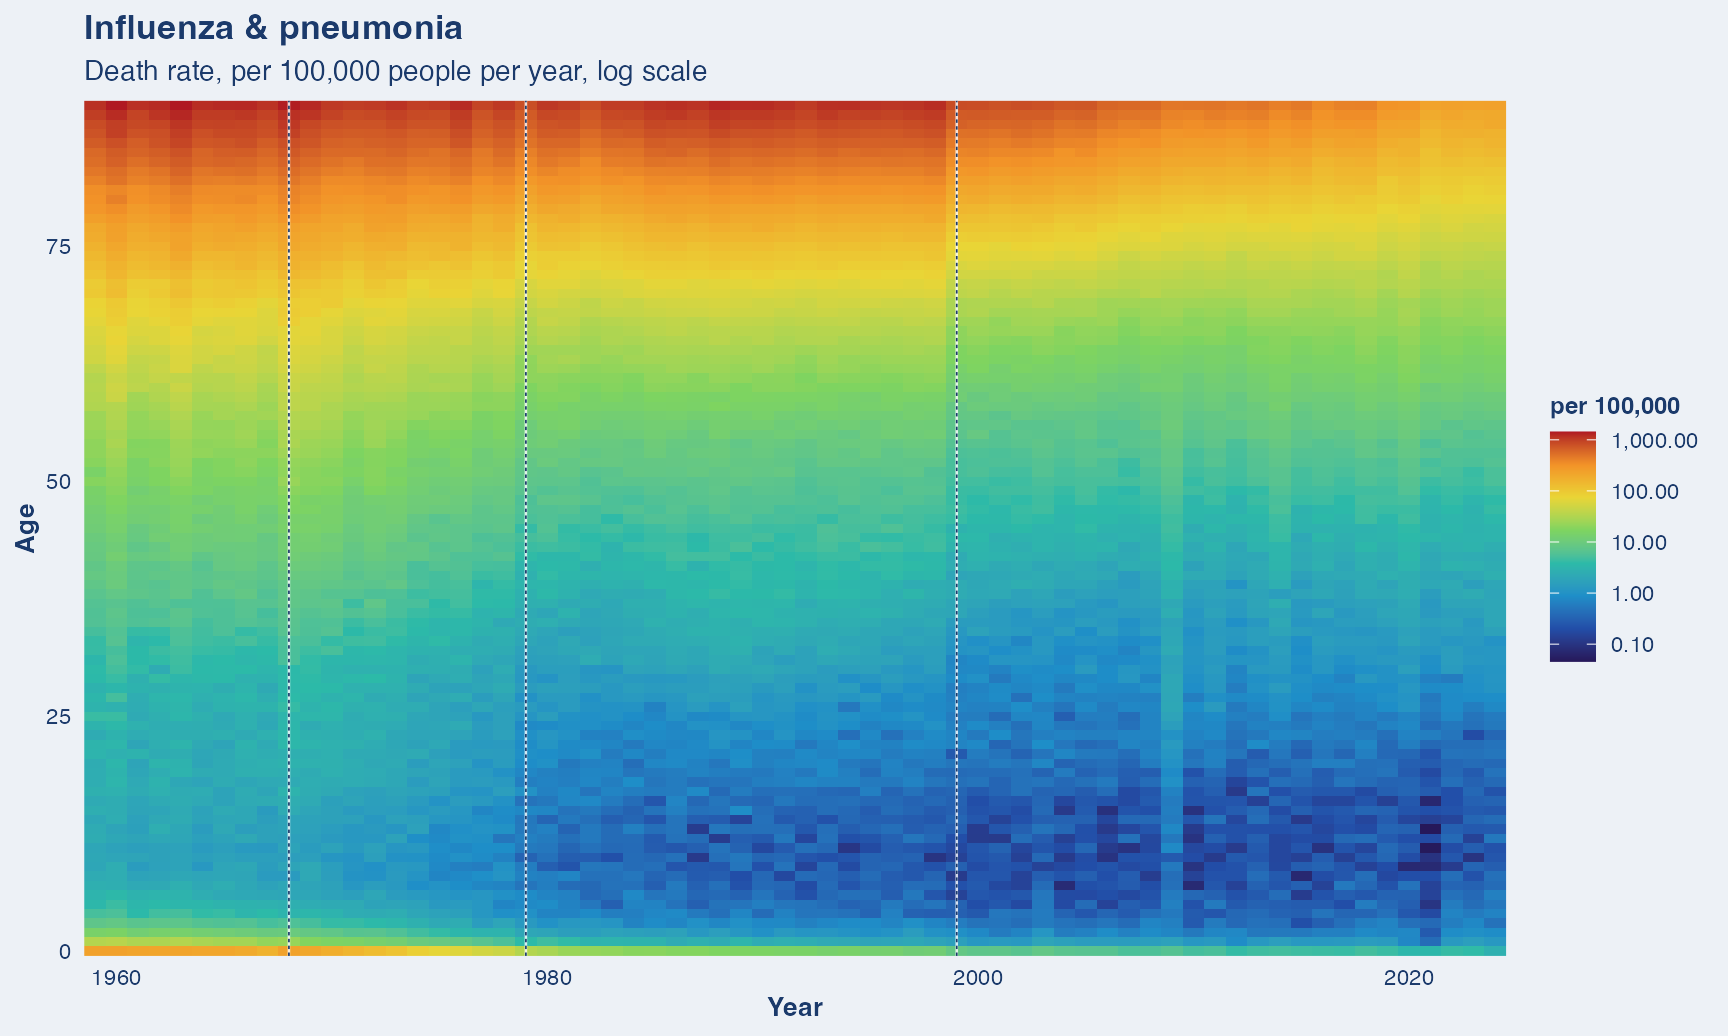
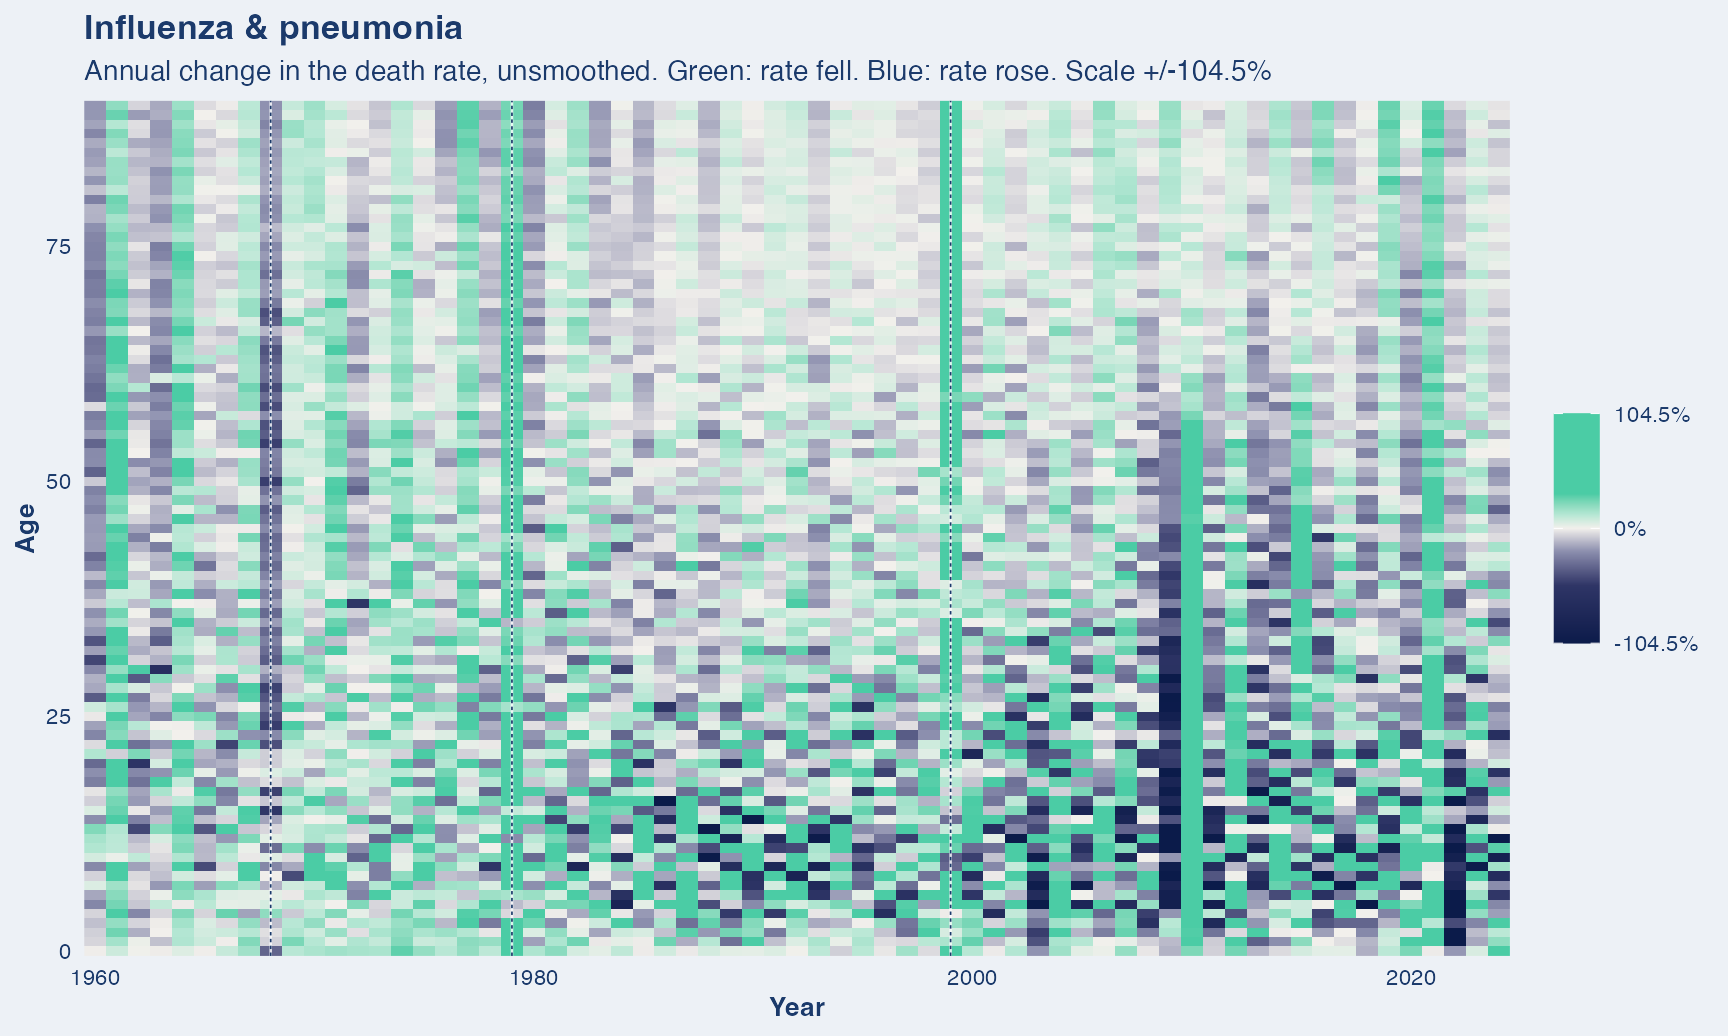
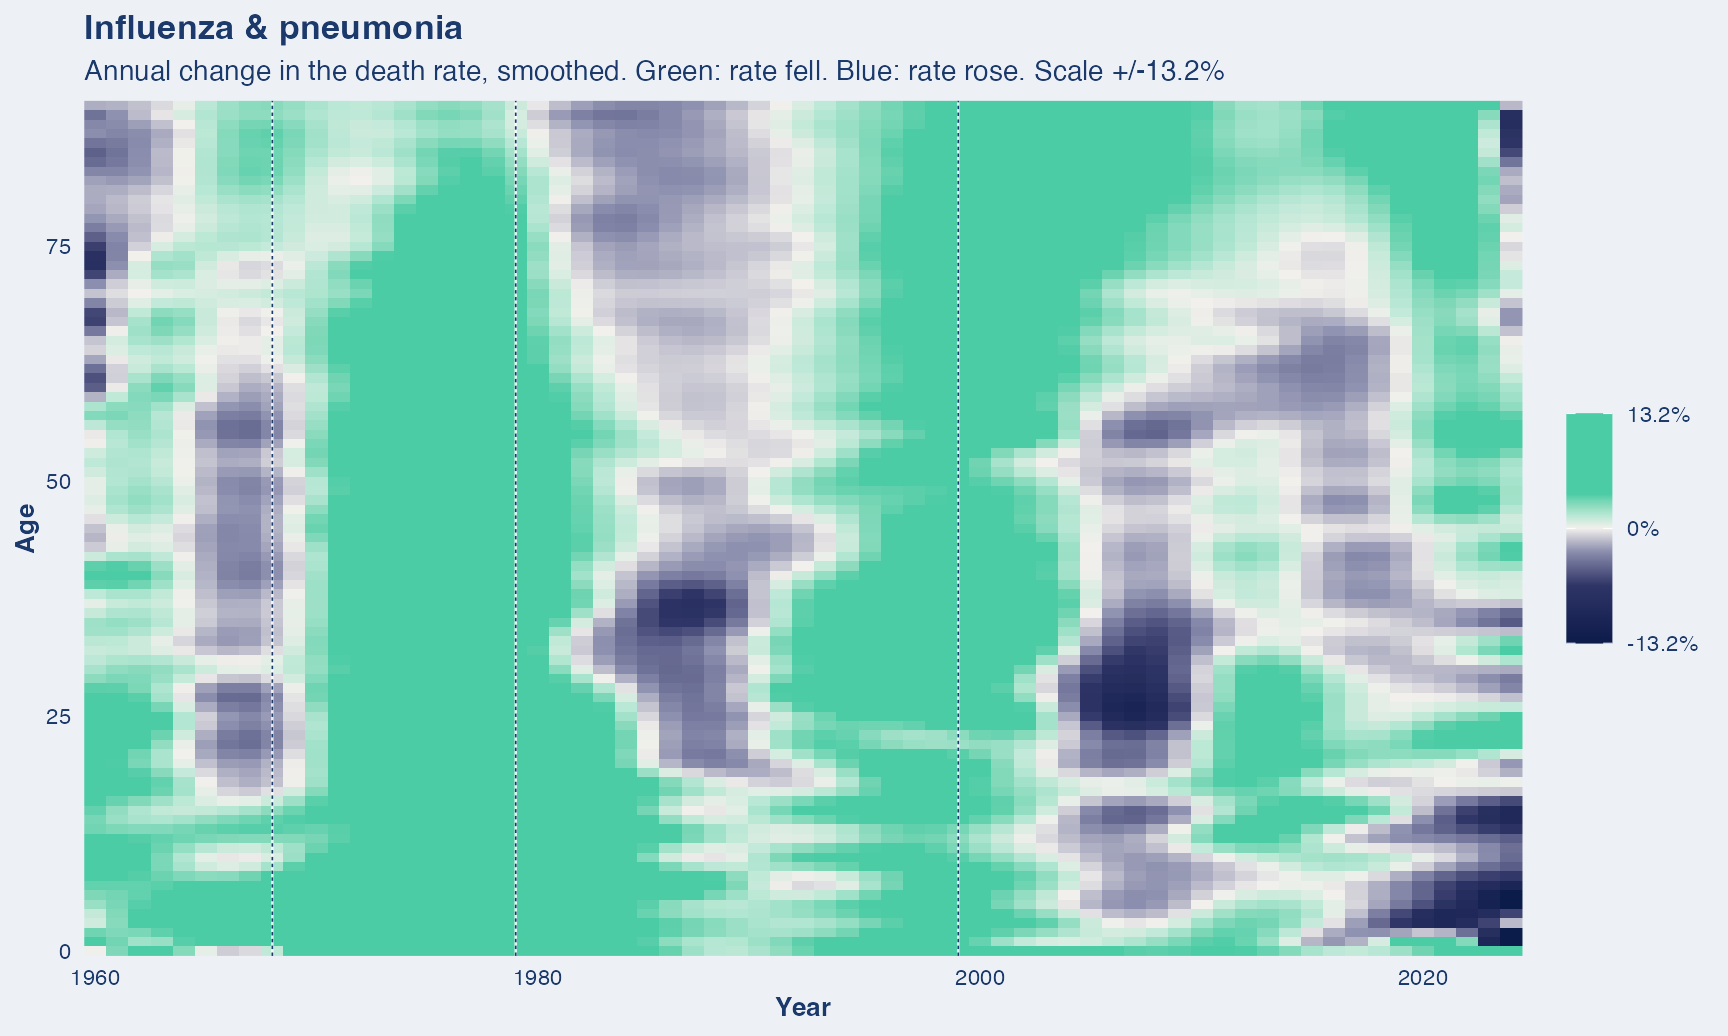
What this covers. Influenza and pneumonia together.
Years shown. 1959 to 2024. The two components are also available separately.
Dashed vertical lines mark ICD revision boundaries (1968, 1979, 1999). A step at one of these is the classification changing, not necessarily mortality.
One source throughout. Deaths for every year come from the NBER mirror of the NCHS Multiple Cause-of-Death files, so nothing in this series is a change of data source.
Influenza only
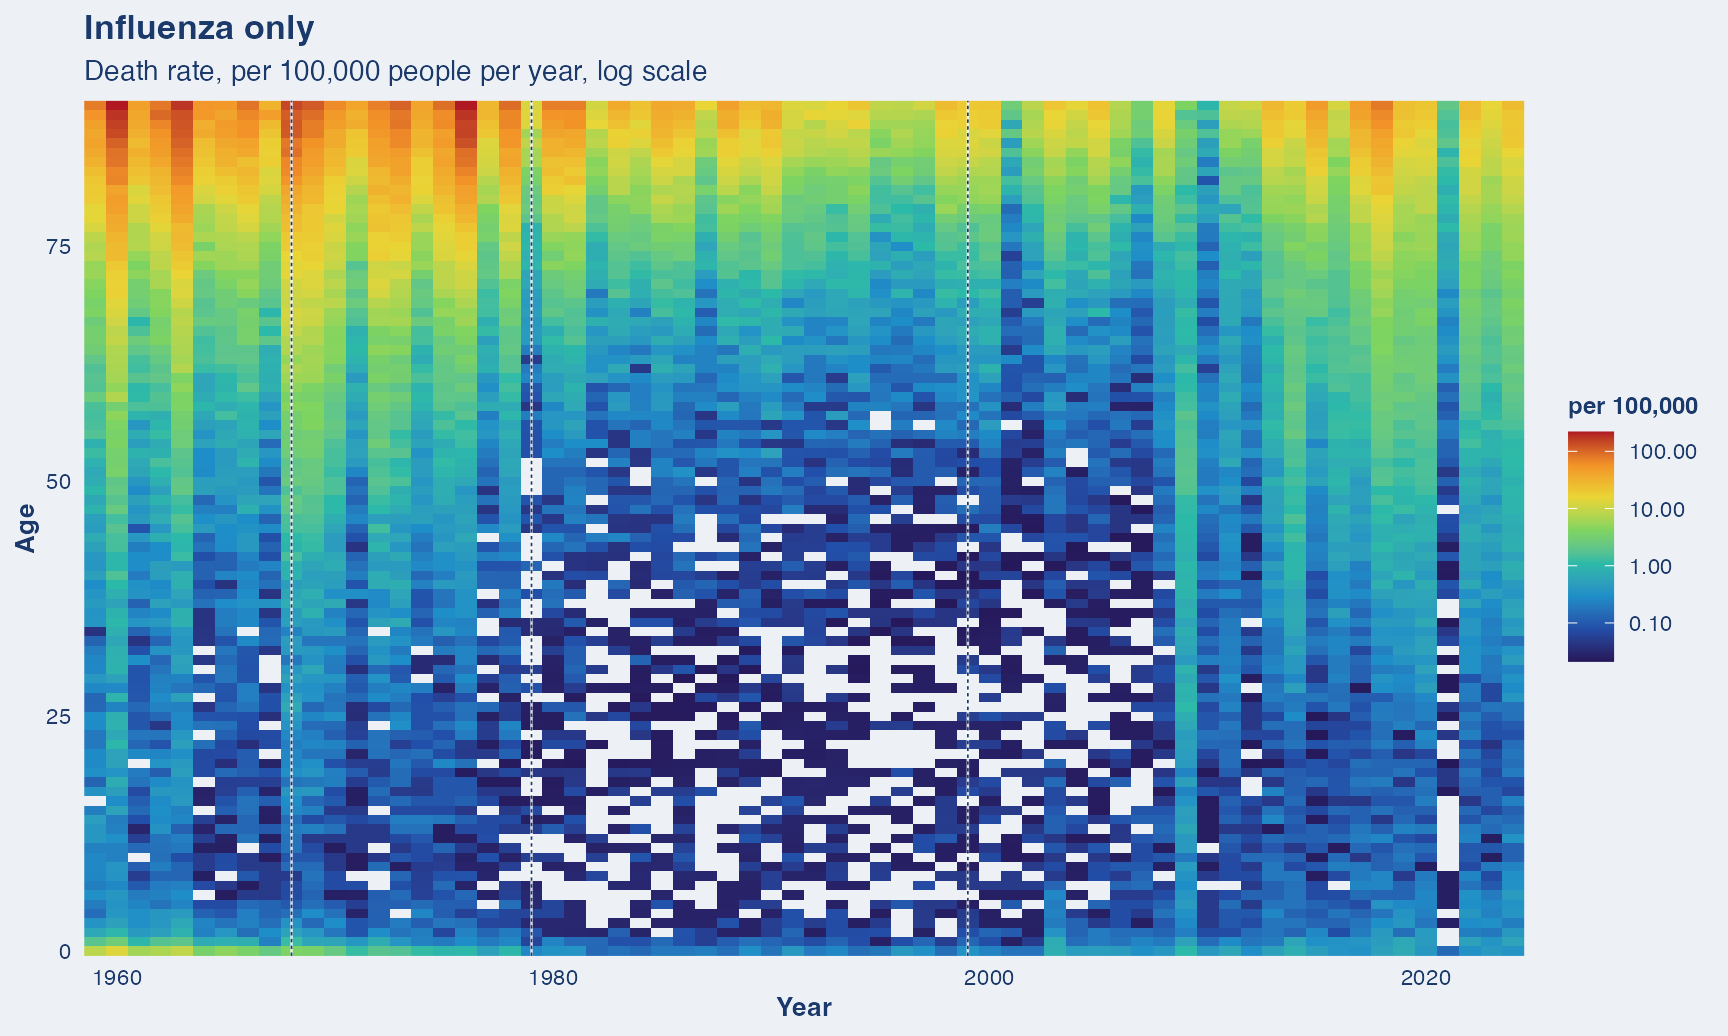
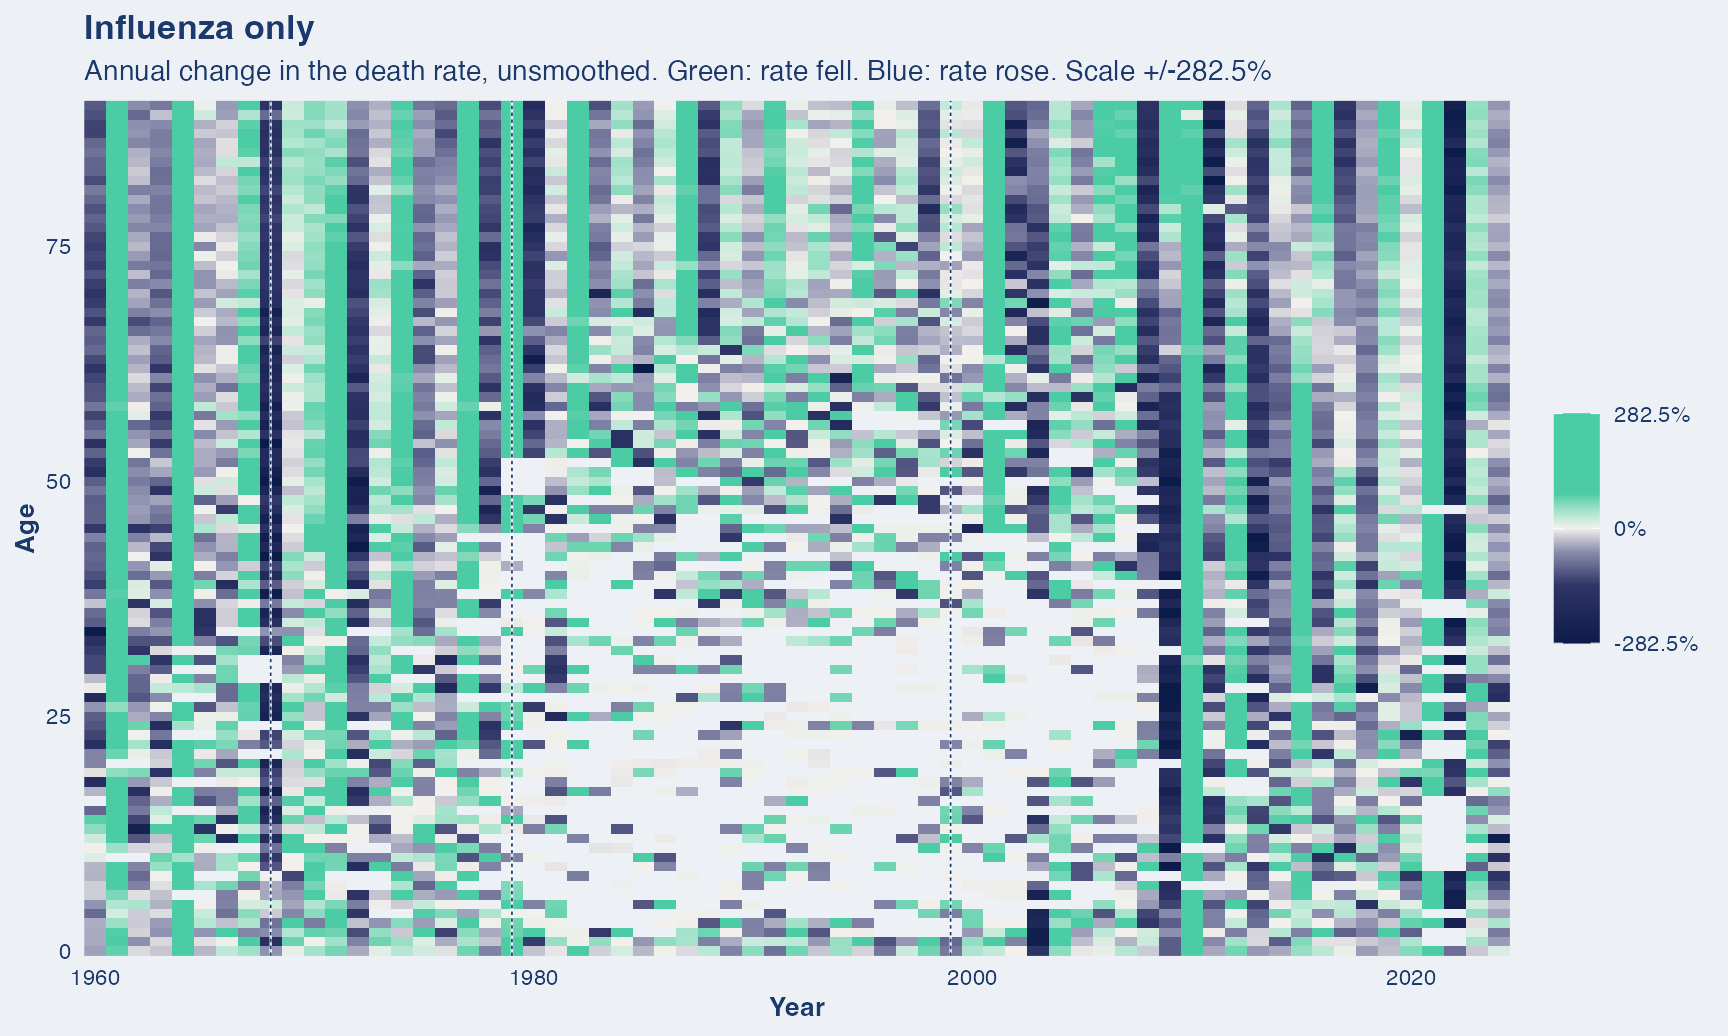
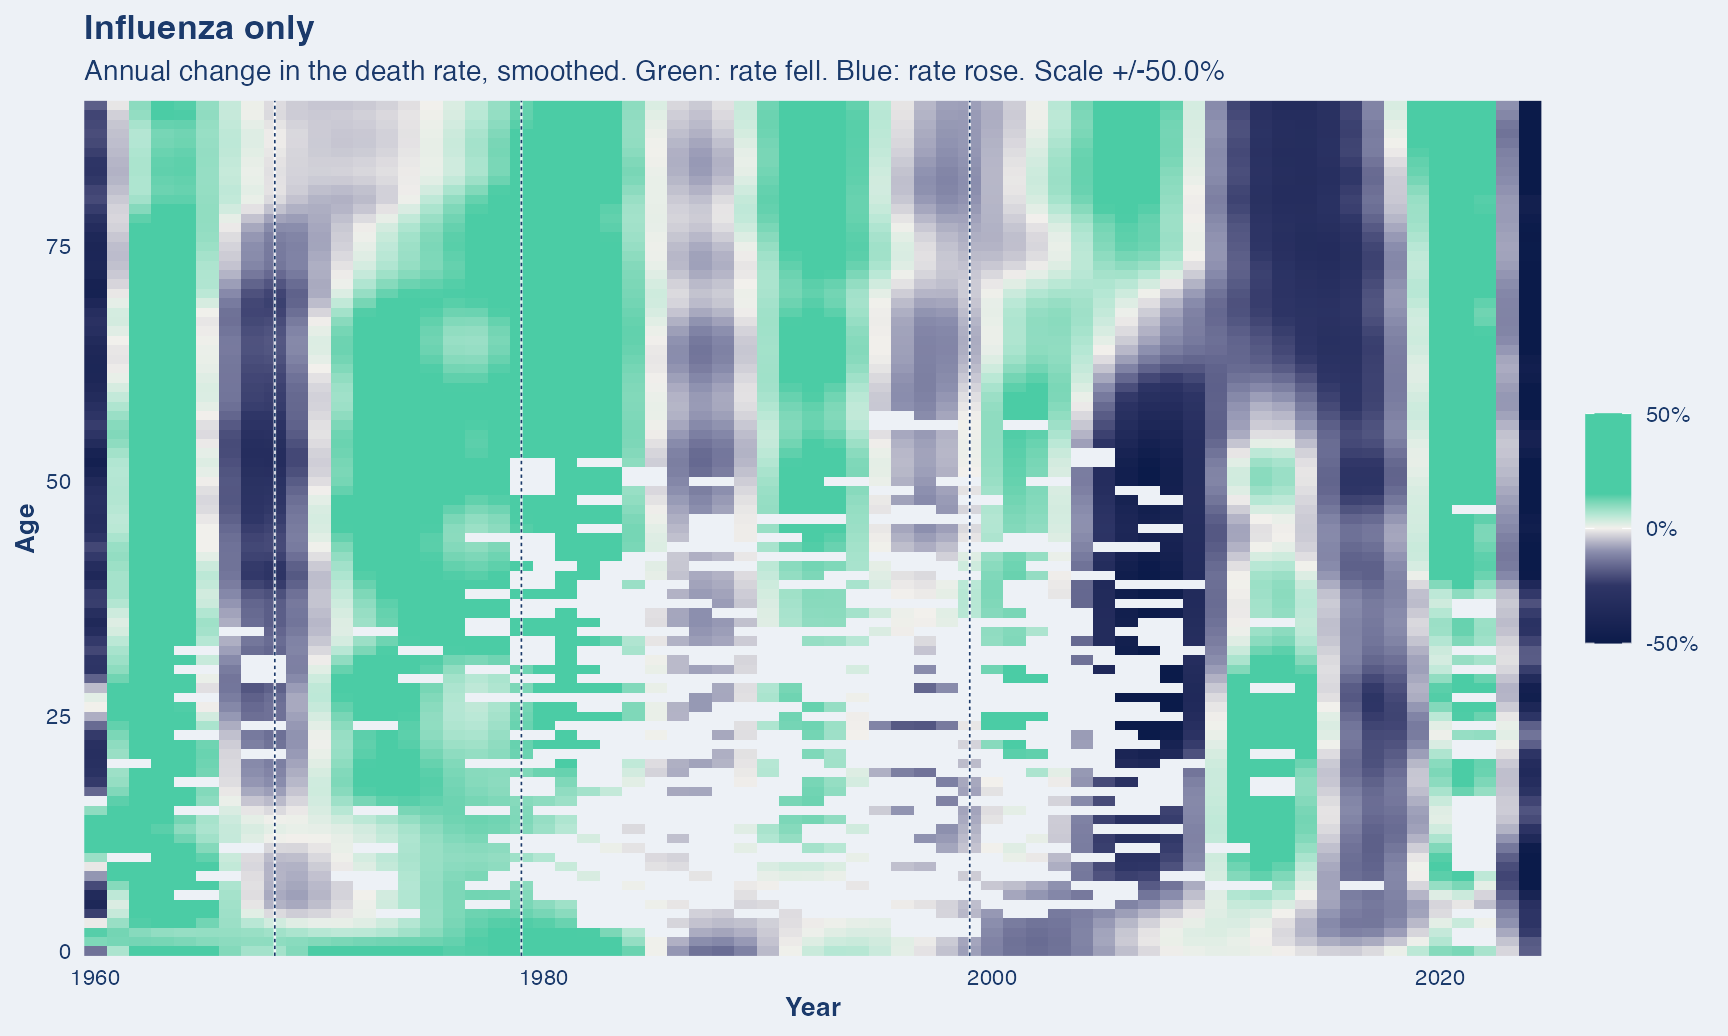
What this covers. Influenza alone, with pneumonia excluded.
Years shown. 1959 to 2024. The influenza and pneumonia codes are separable in every revision, but the line between them depends on what the certifier wrote.
Dashed vertical lines mark ICD revision boundaries (1968, 1979, 1999). A step at one of these is the classification changing, not necessarily mortality.
One source throughout. Deaths for every year come from the NBER mirror of the NCHS Multiple Cause-of-Death files, so nothing in this series is a change of data source.
Influenza is spiky, pneumonia is not. Over the years available, influenza runs from 257 deaths in its quietest year to 7,877 in its worst, a factor of 31. Pneumonia moves by a factor of 2 across the same span. Almost all of the year-to-year movement in the combined series is influenza; almost all of its level is pneumonia.
1968 is the largest single-year rise in the series, 1,474 deaths to 7,059, up 379%. It coincides with the 1968-69 H3N2 pandemic, the so-called Hong Kong flu. Other sharp years include 1960, 1963, and the 2009 Swine Flu outbreak. In 2021, flu takes a curious break during the COVID-19 pandemic.
ICD Splits are visible in 1979 and 1999 - The line between influenza and pneumonia is drawn differently in each ICD revision, and the two boundaries are visible in the counts. Influenza falls from 4,051 in 1978 to 604 in 1979, which is ICD-9 narrowing influenza to a single code rather than a mild season. Pneumonia falls 31% at 1999 for the same kind of reason. Neither step is epidemiological. The combined series does not have this problem, which is why it is the one to use across long spans.
Pneumonia only
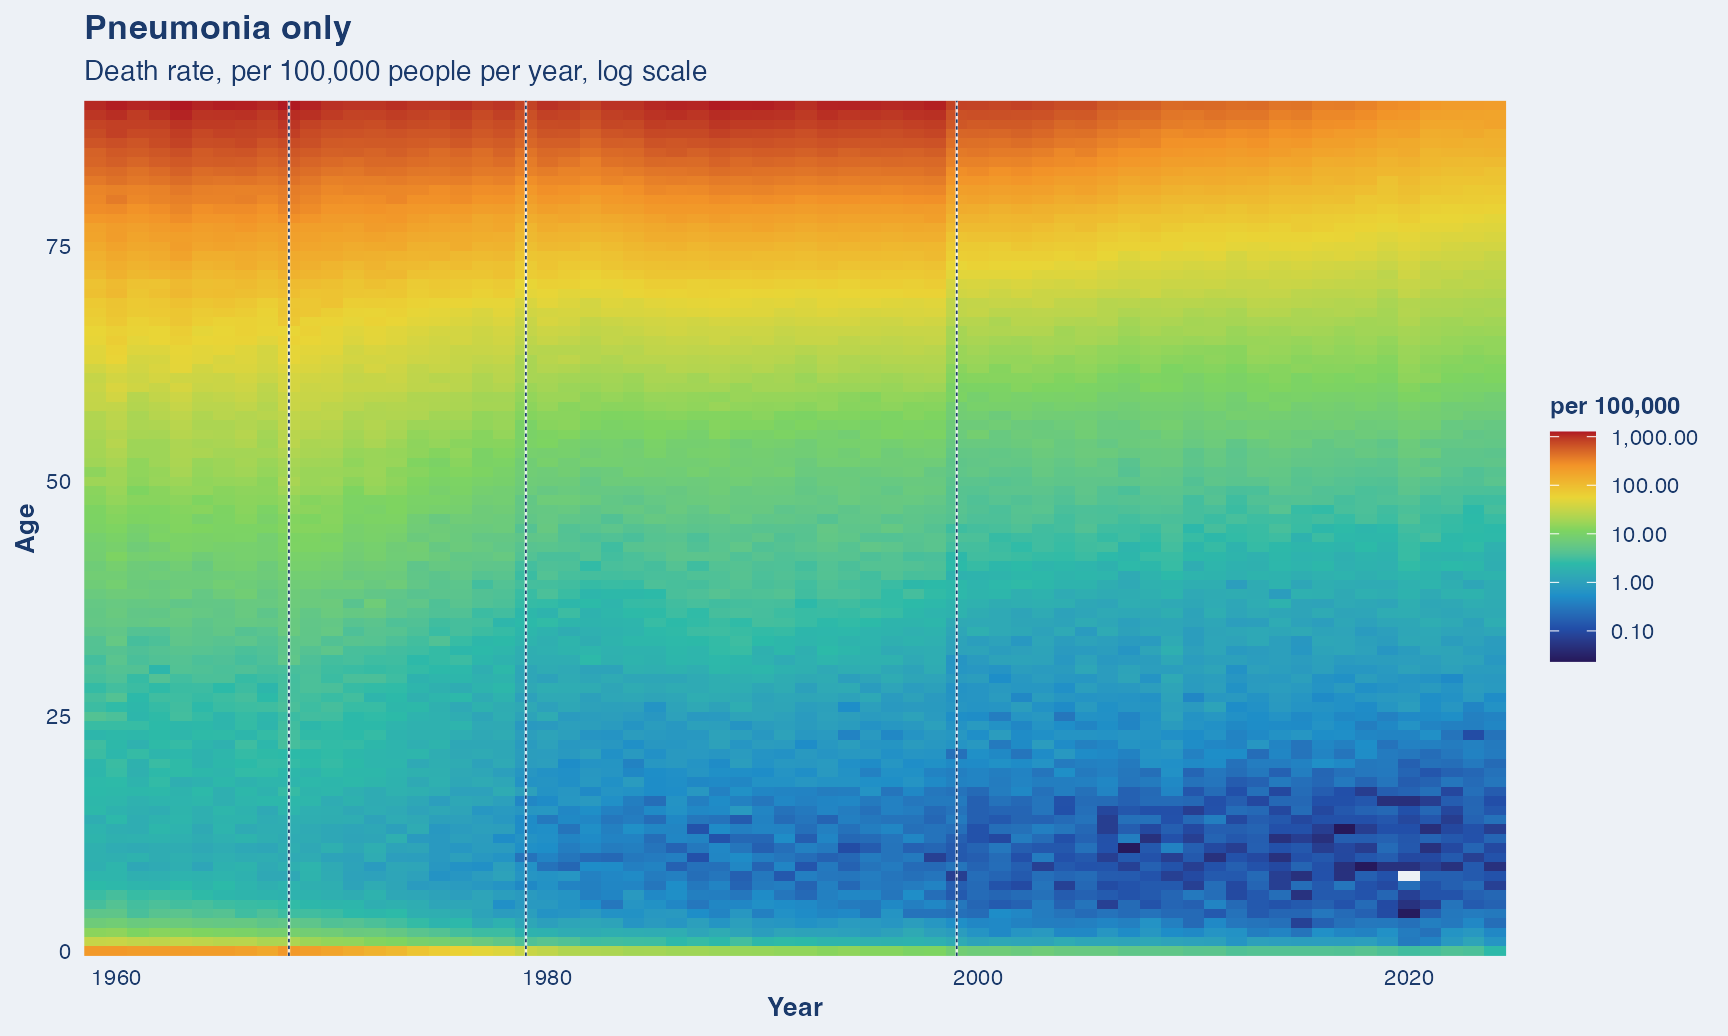
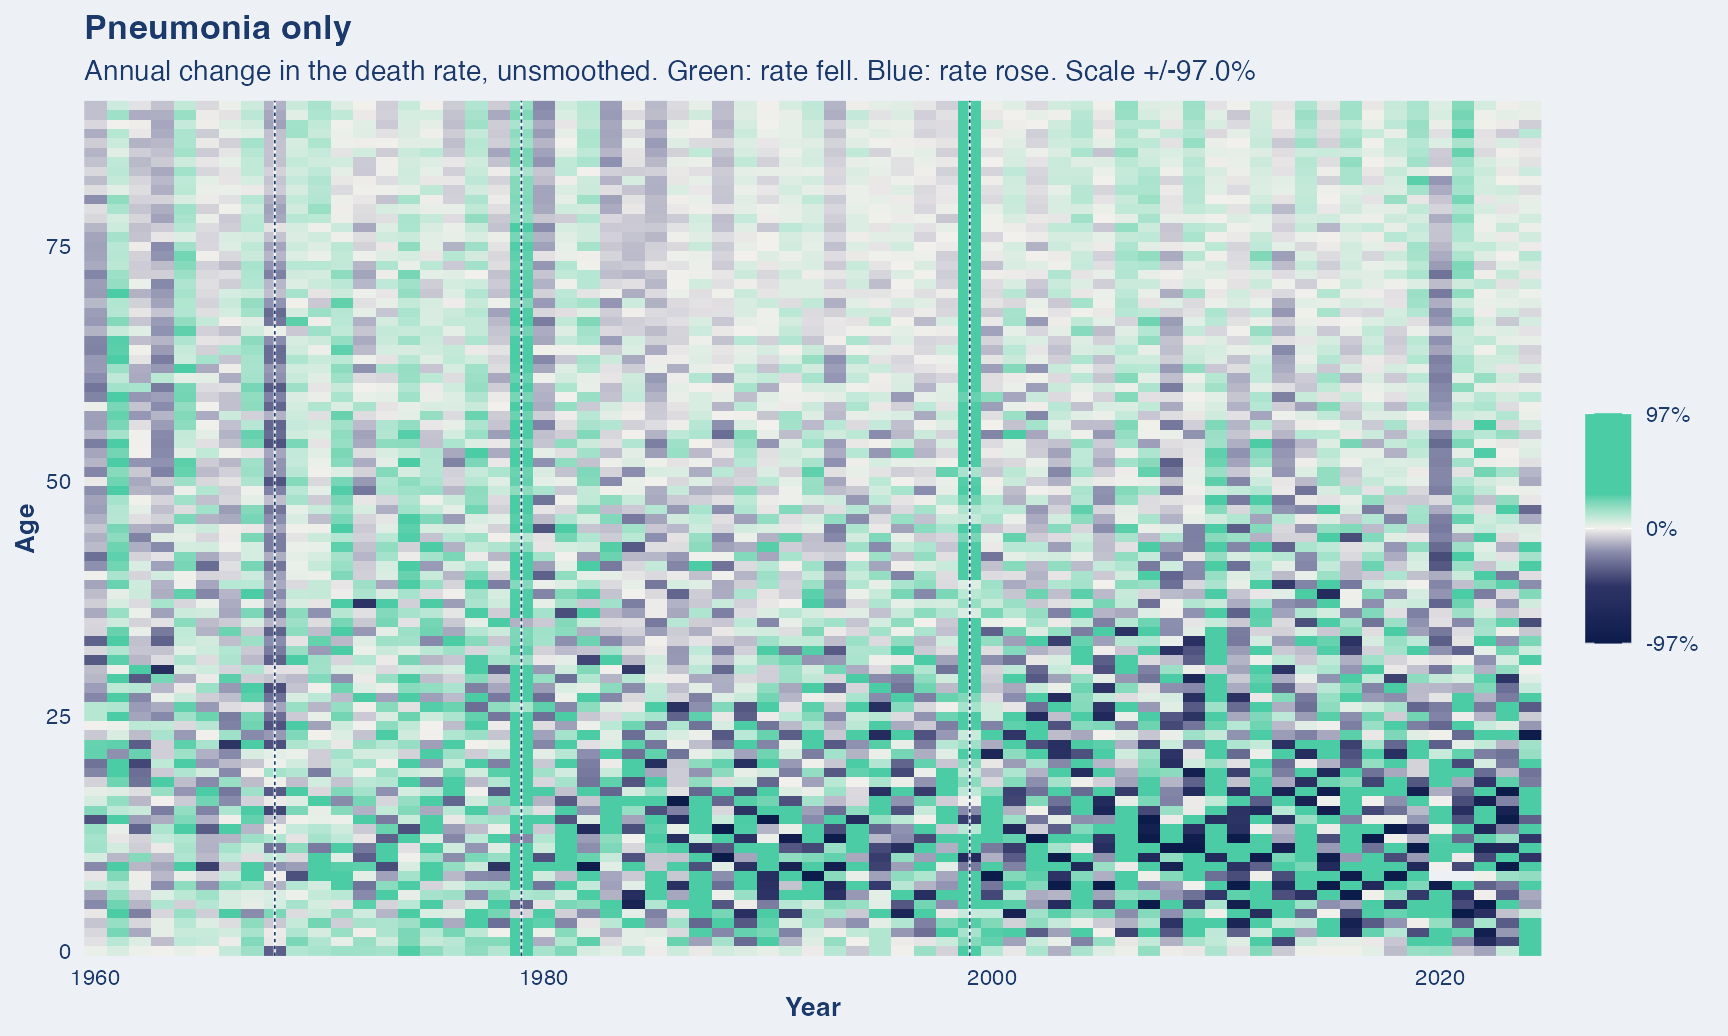
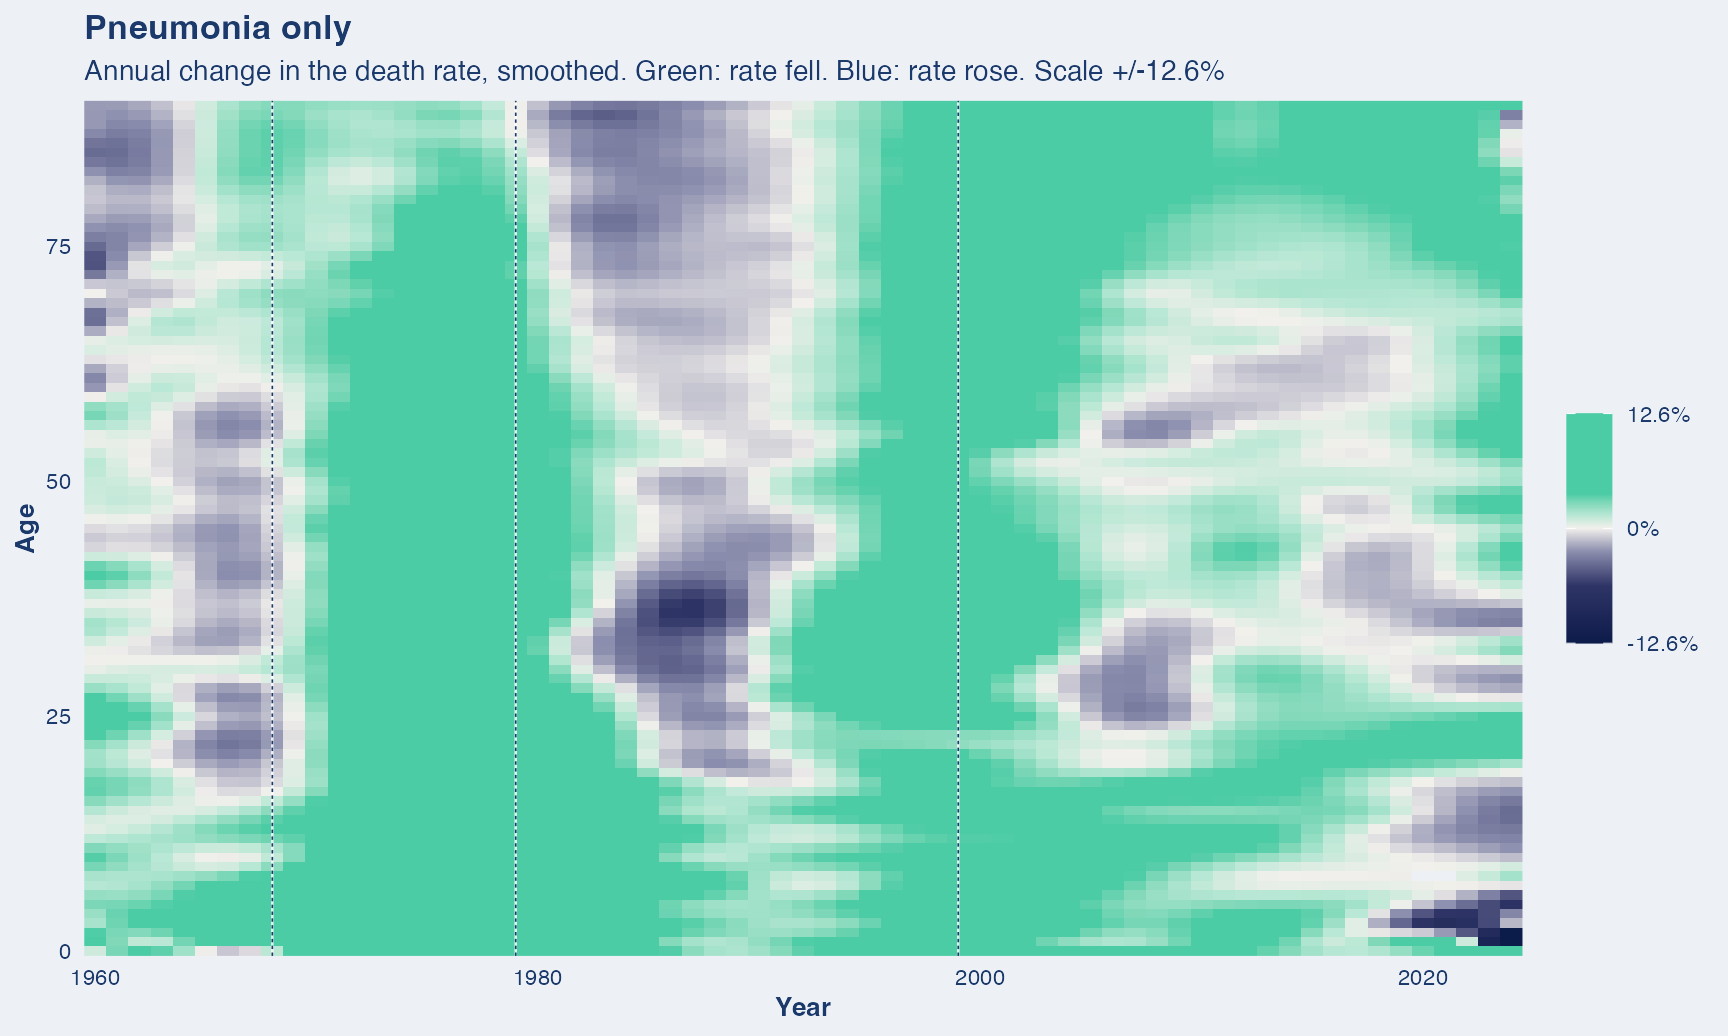
What this covers. Pneumonia alone, with influenza excluded.
Years shown. 1959 to 2024. The influenza and pneumonia codes are separable in every revision, but the line between them depends on what the certifier wrote.
Dashed vertical lines mark ICD revision boundaries (1968, 1979, 1999). A step at one of these is the classification changing, not necessarily mortality.
One source throughout. Deaths for every year come from the NBER mirror of the NCHS Multiple Cause-of-Death files, so nothing in this series is a change of data source.
Influenza is spiky, pneumonia is not. Over the years available, influenza runs from 257 deaths in its quietest year to 7,877 in its worst, a factor of 31. Pneumonia moves by a factor of 2 across the same span. Almost all of the year-to-year movement in the combined series is influenza; almost all of its level is pneumonia.
1968 is the largest single-year rise in the series, 1,474 deaths to 7,059, up 379%. It coincides with the 1968-69 H3N2 pandemic, the so-called Hong Kong flu. Other sharp years include 1960, 1963, and the 2009 Swine Flu outbreak. In 2021, flu takes a curious break during the COVID-19 pandemic.
ICD Splits are visible in 1979 and 1999 - The line between influenza and pneumonia is drawn differently in each ICD revision, and the two boundaries are visible in the counts. Influenza falls from 4,051 in 1978 to 604 in 1979, which is ICD-9 narrowing influenza to a single code rather than a mild season. Pneumonia falls 31% at 1999 for the same kind of reason. Neither step is epidemiological. The combined series does not have this problem, which is why it is the one to use across long spans.
HIV/AIDS
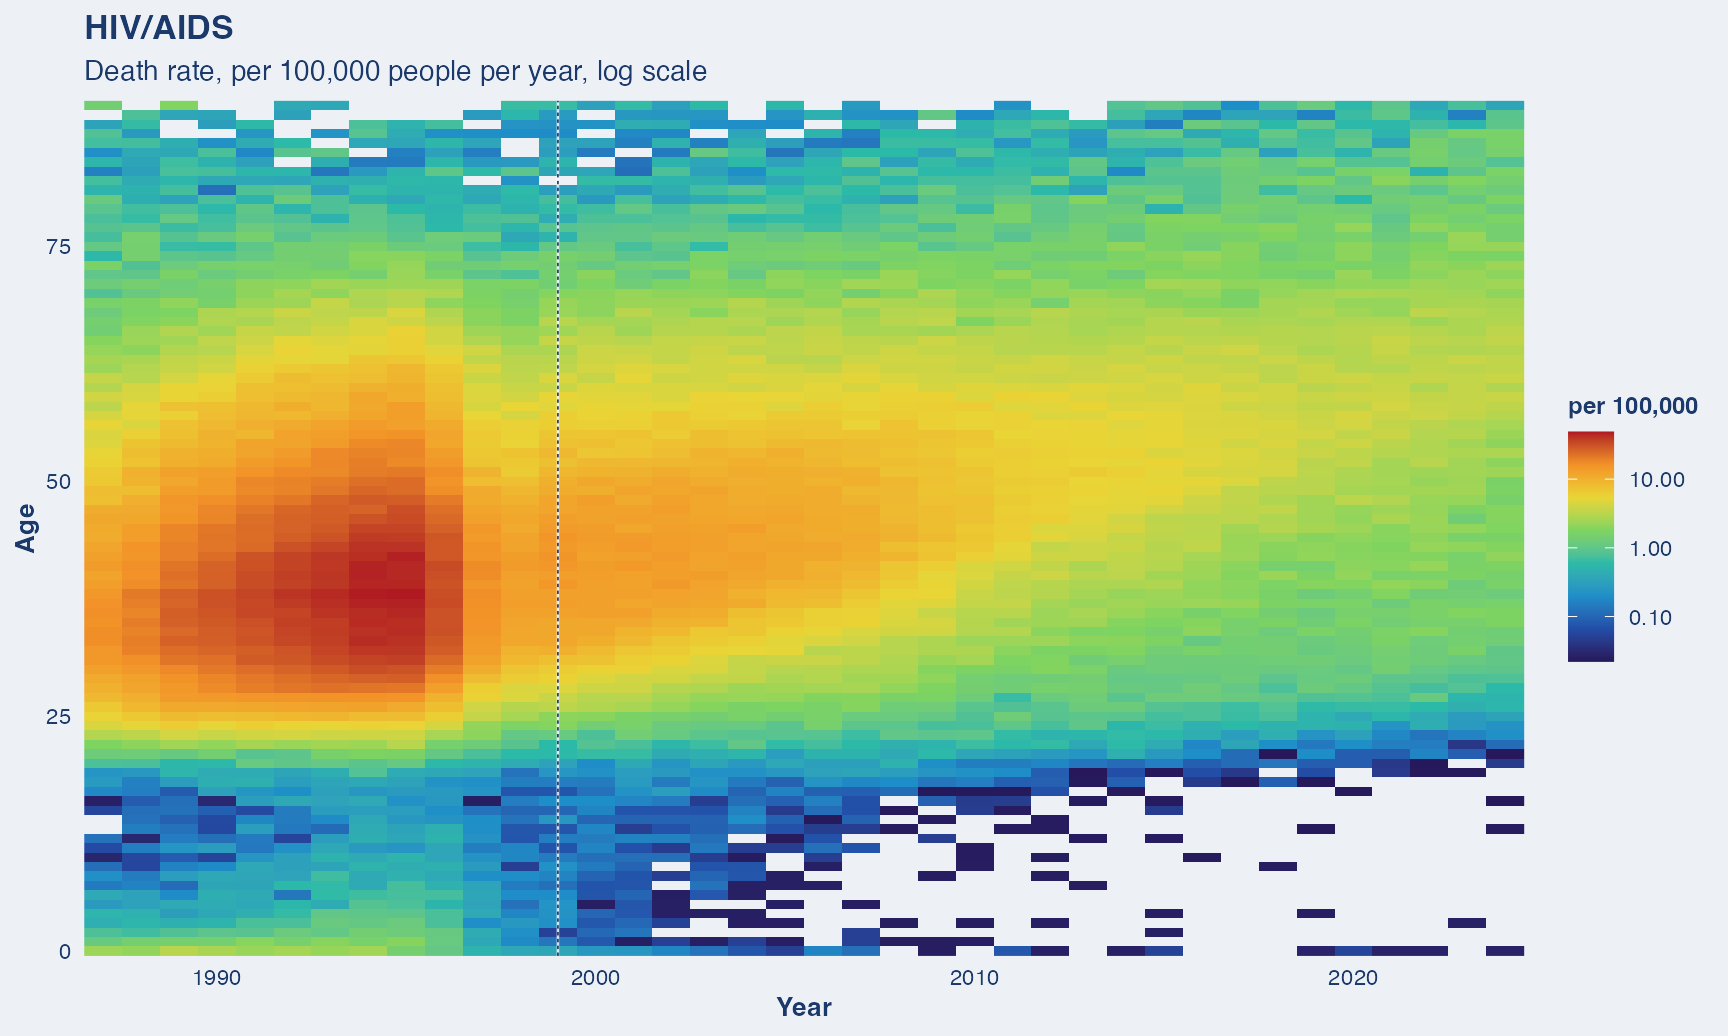
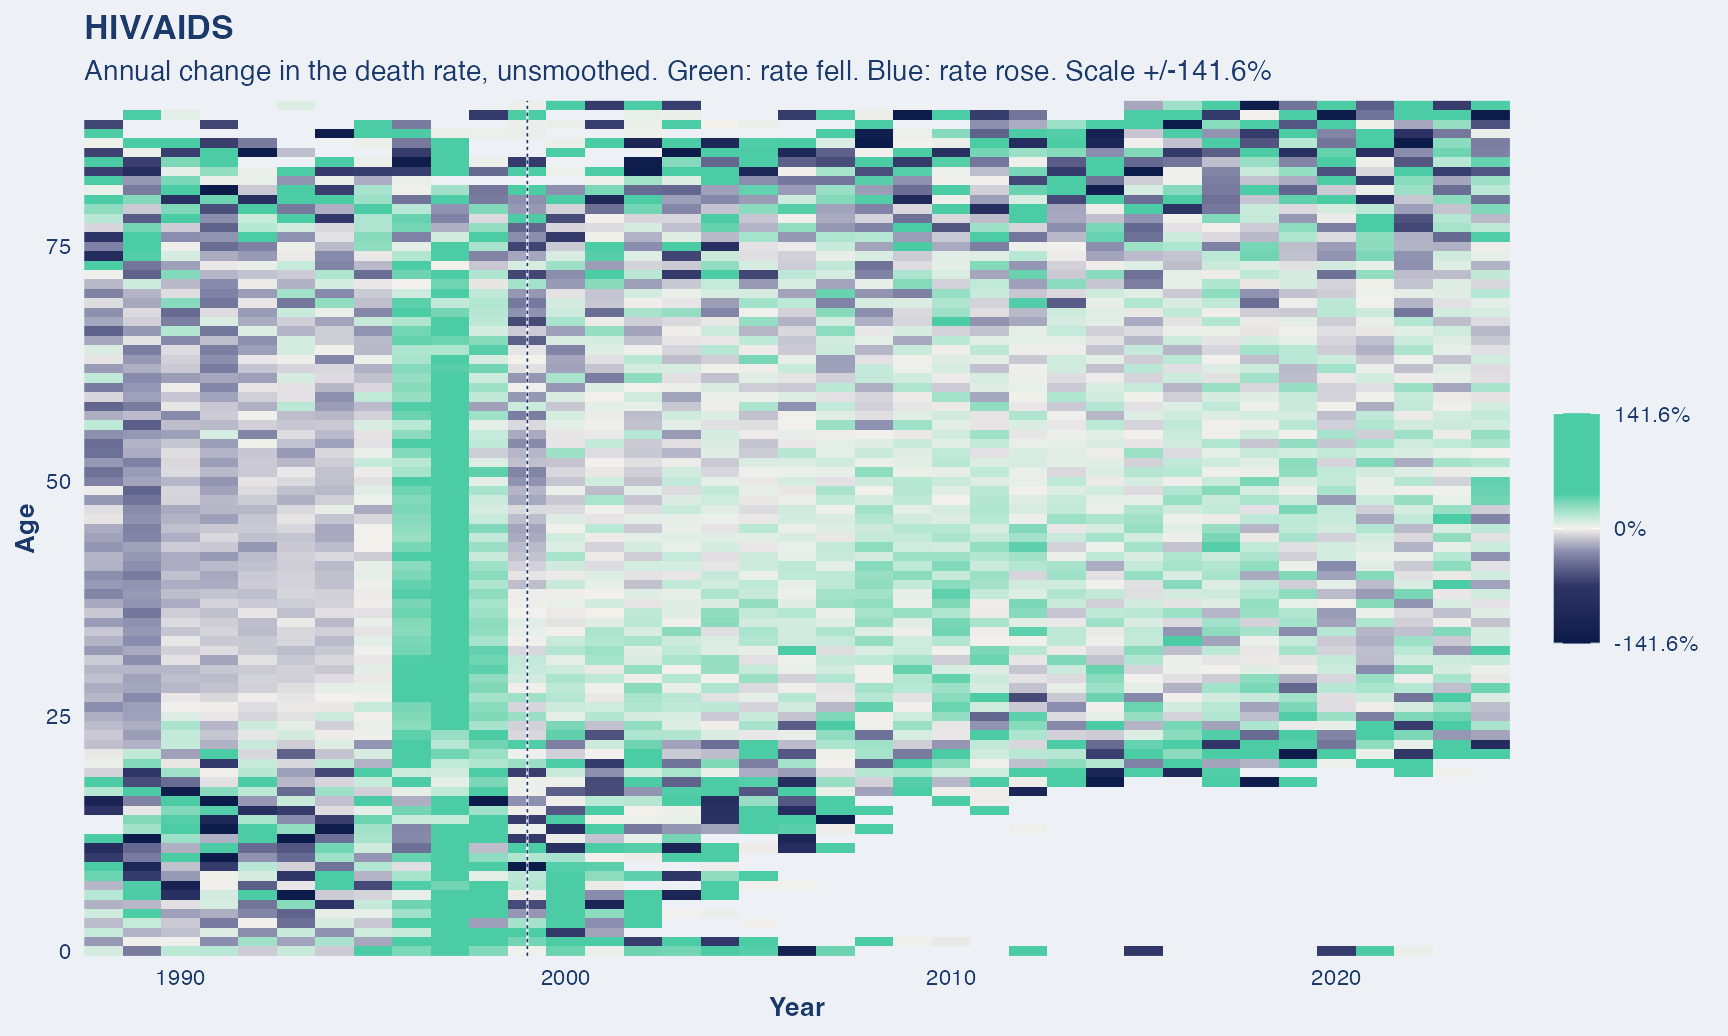
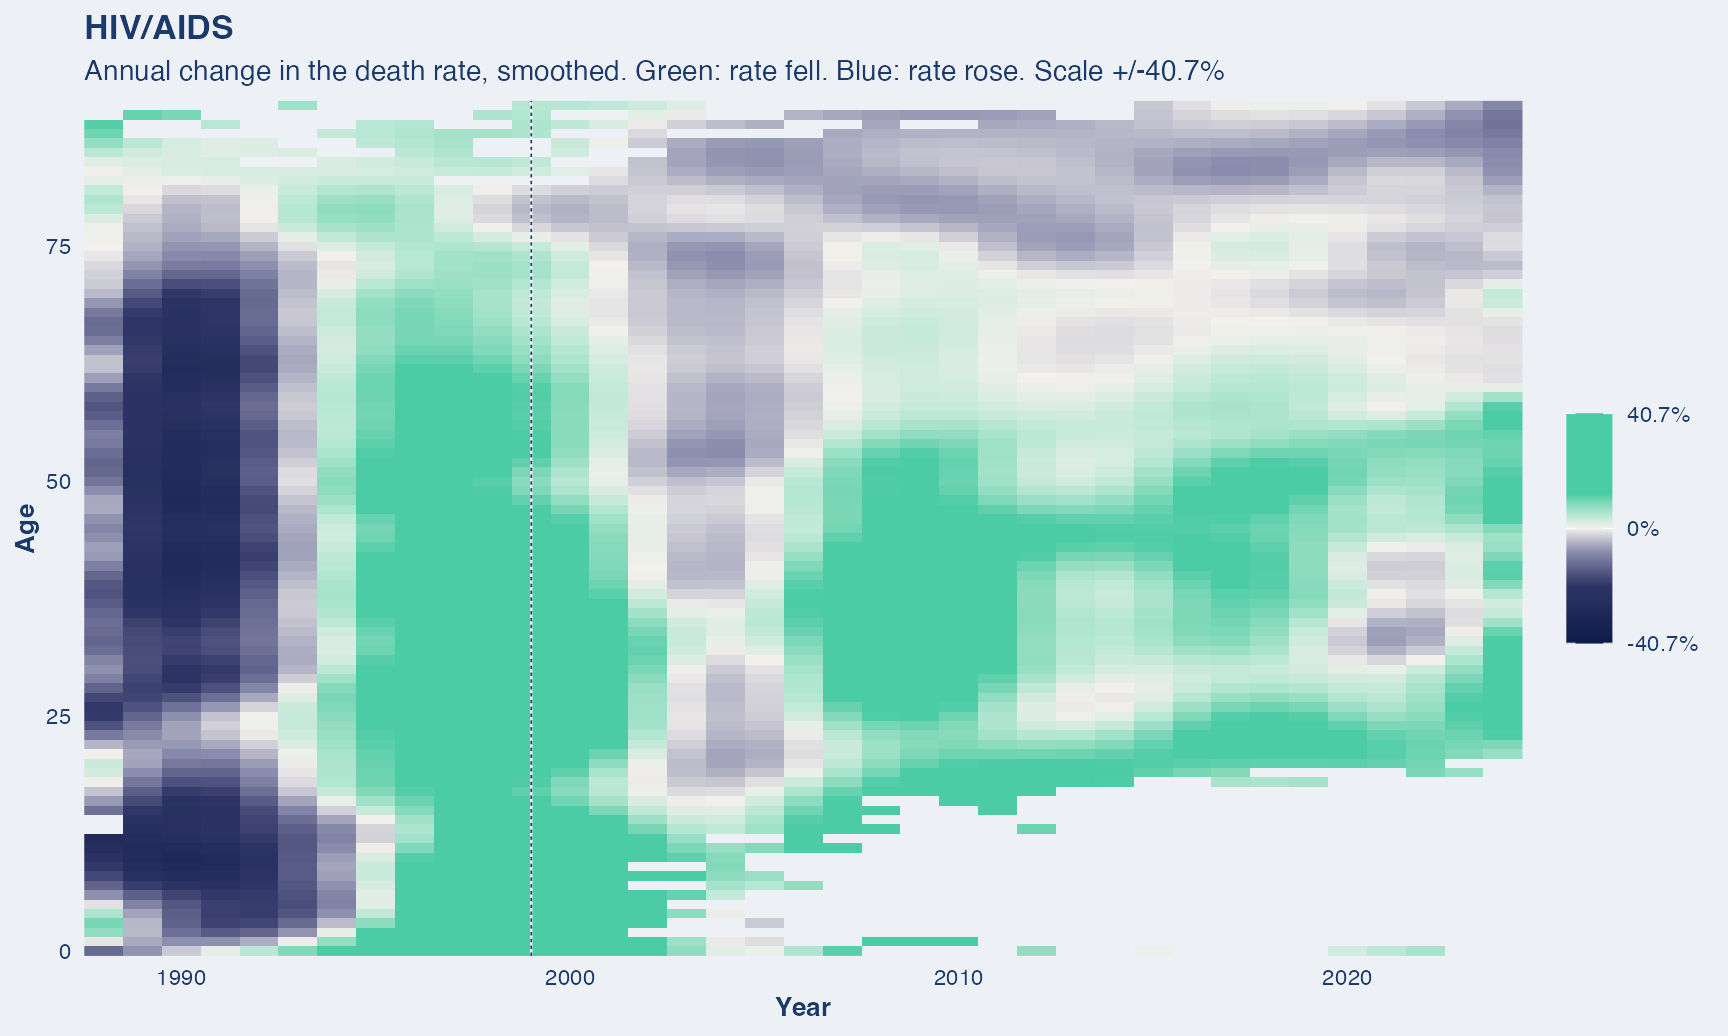
What this covers. Death from HIV infection and its complications.
Years shown. 1987 to 2024. No ICD code existed for HIV before 1987, so the series starts there.
Dashed vertical lines mark ICD revision boundaries (1999). A step at one of these is the classification changing, not necessarily mortality.
One source throughout. Deaths for every year come from the NBER mirror of the NCHS Multiple Cause-of-Death files, so nothing in this series is a change of data source.
COVID-19
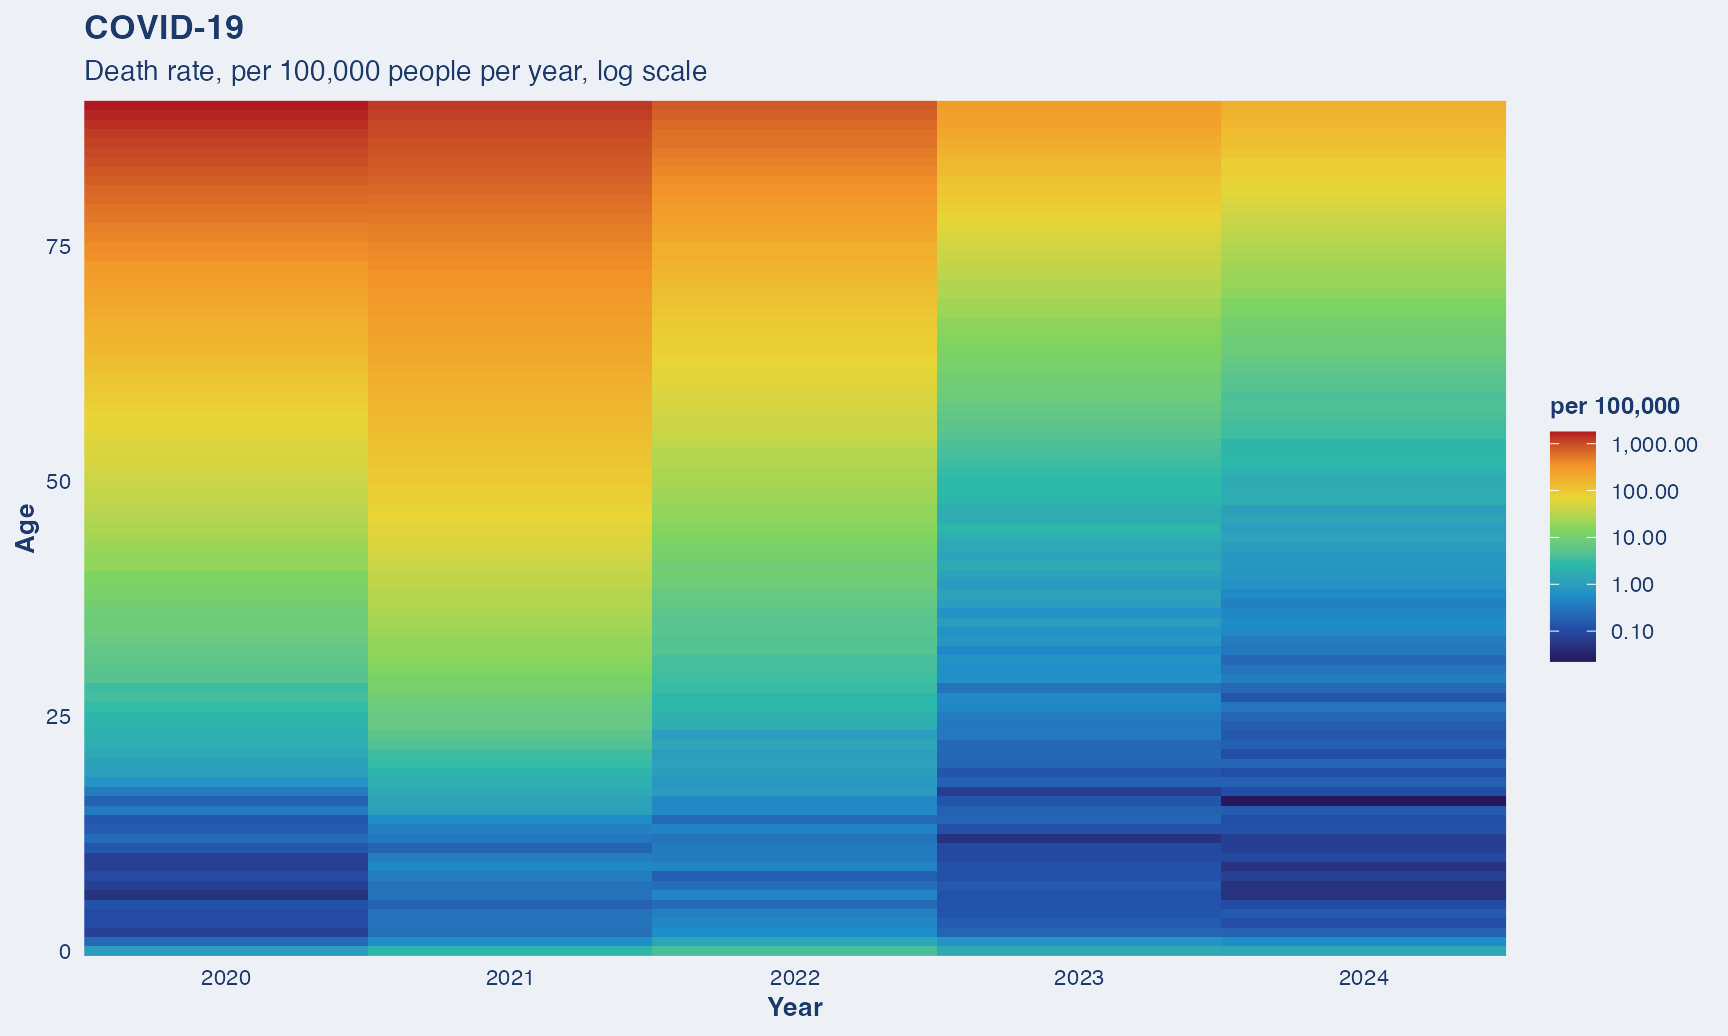
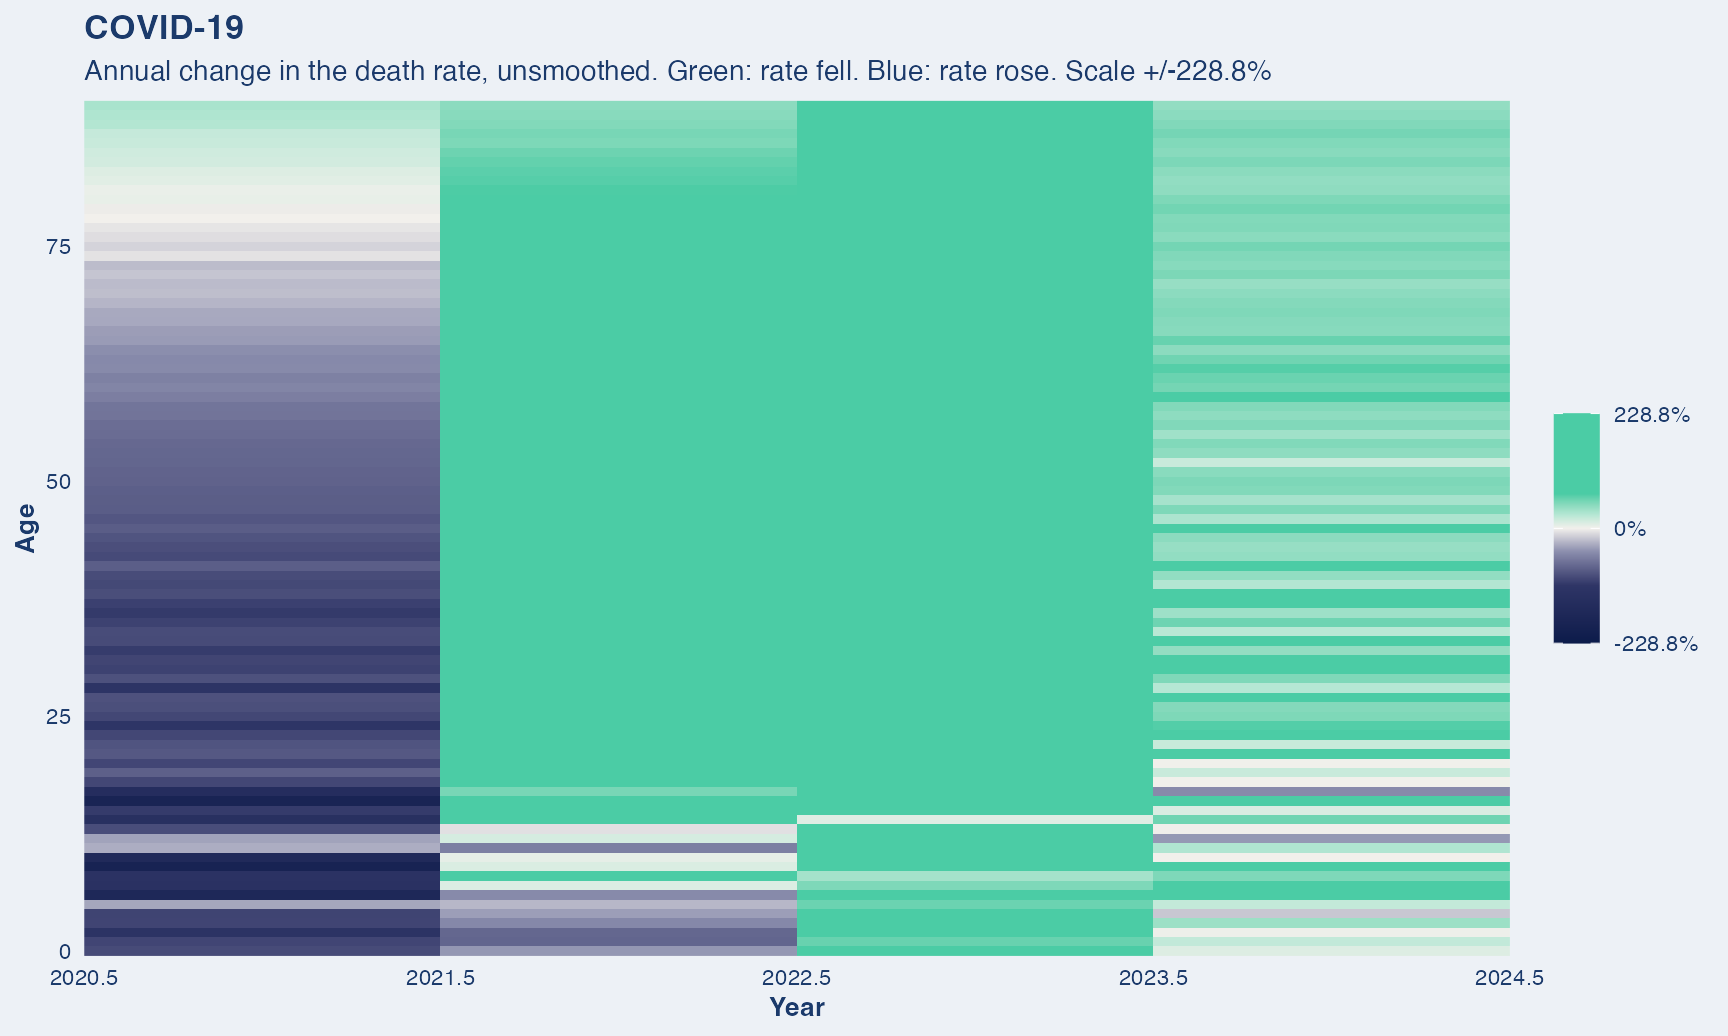
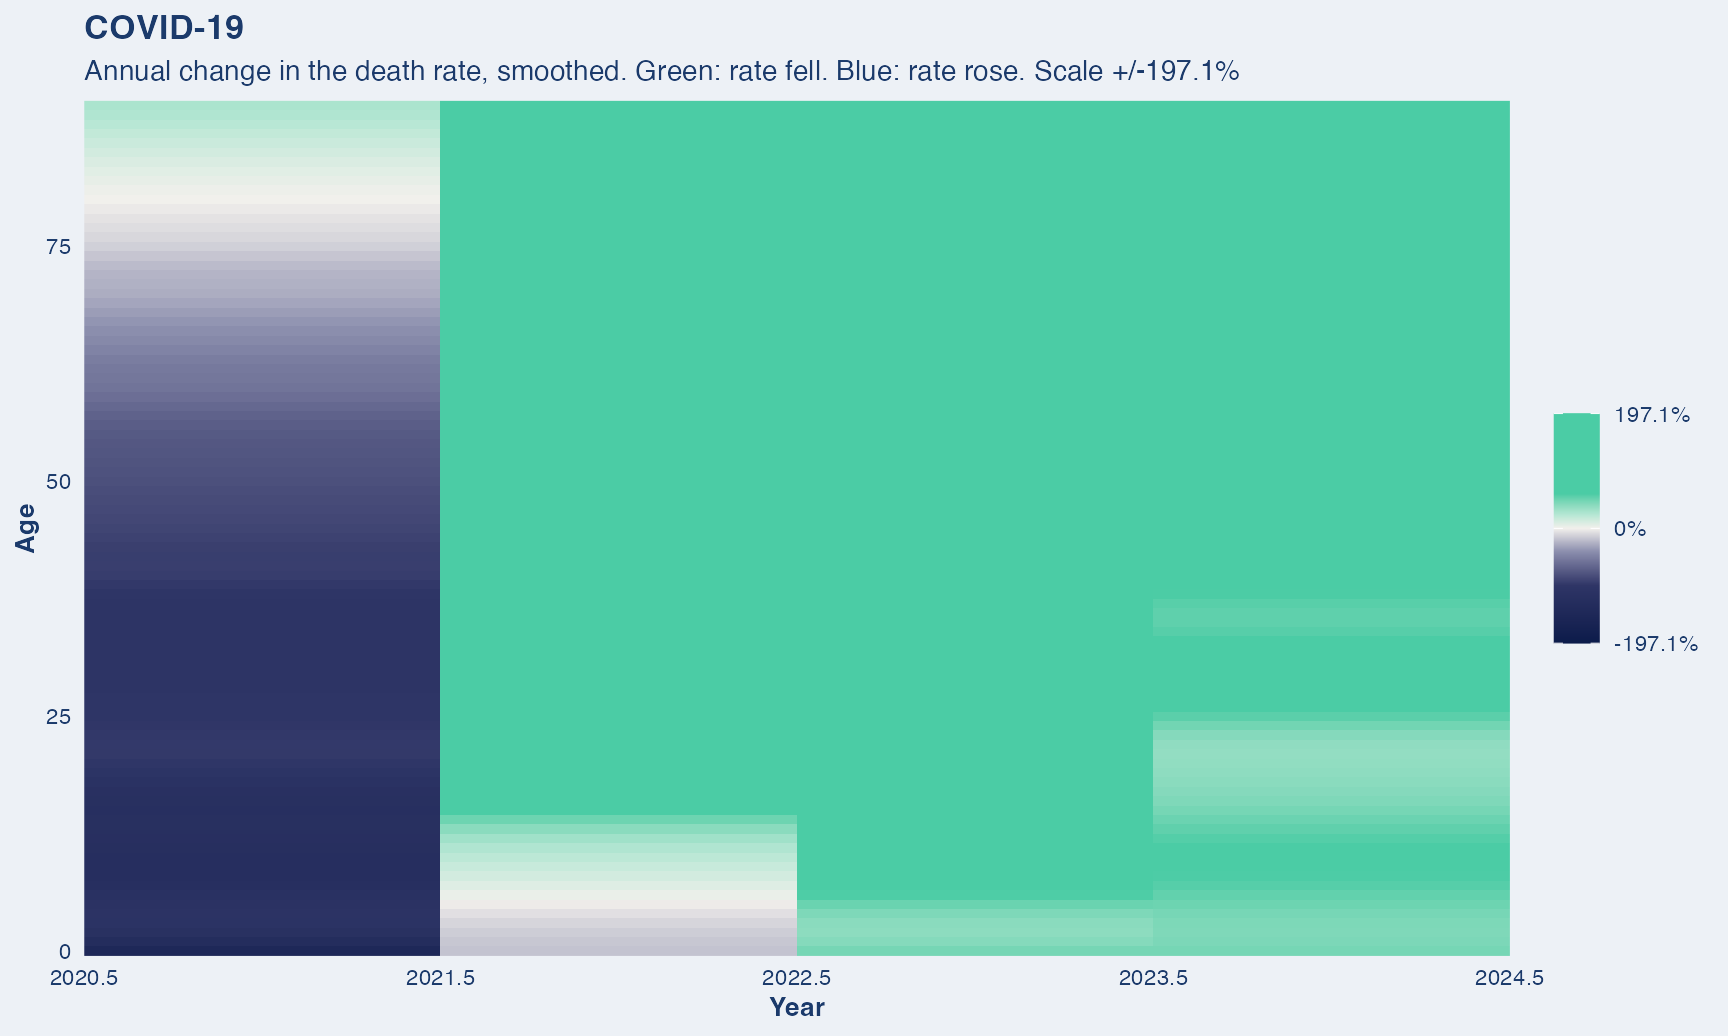
What this covers. Death from COVID-19.
Years shown. 2020 to 2024. Code U07.1, introduced in 2020.
One source throughout. Deaths for every year come from the NBER mirror of the NCHS Multiple Cause-of-Death files, so nothing in this series is a change of data source.
Chronic disease
Diabetes
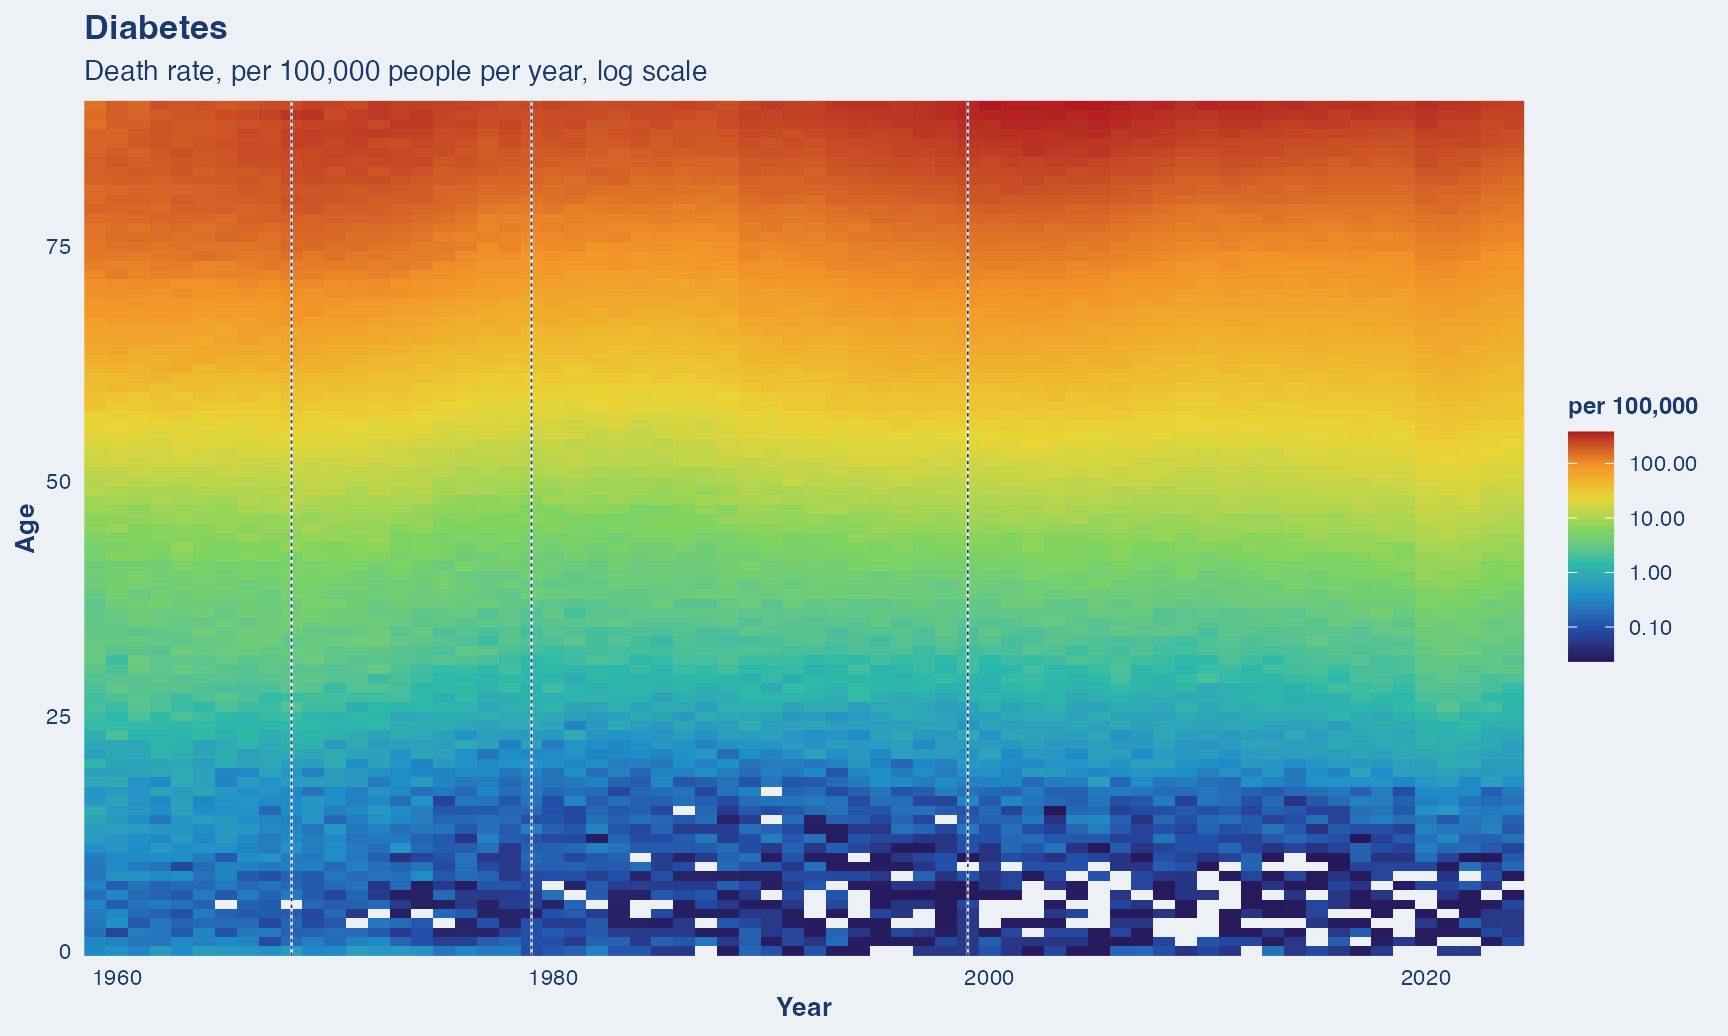
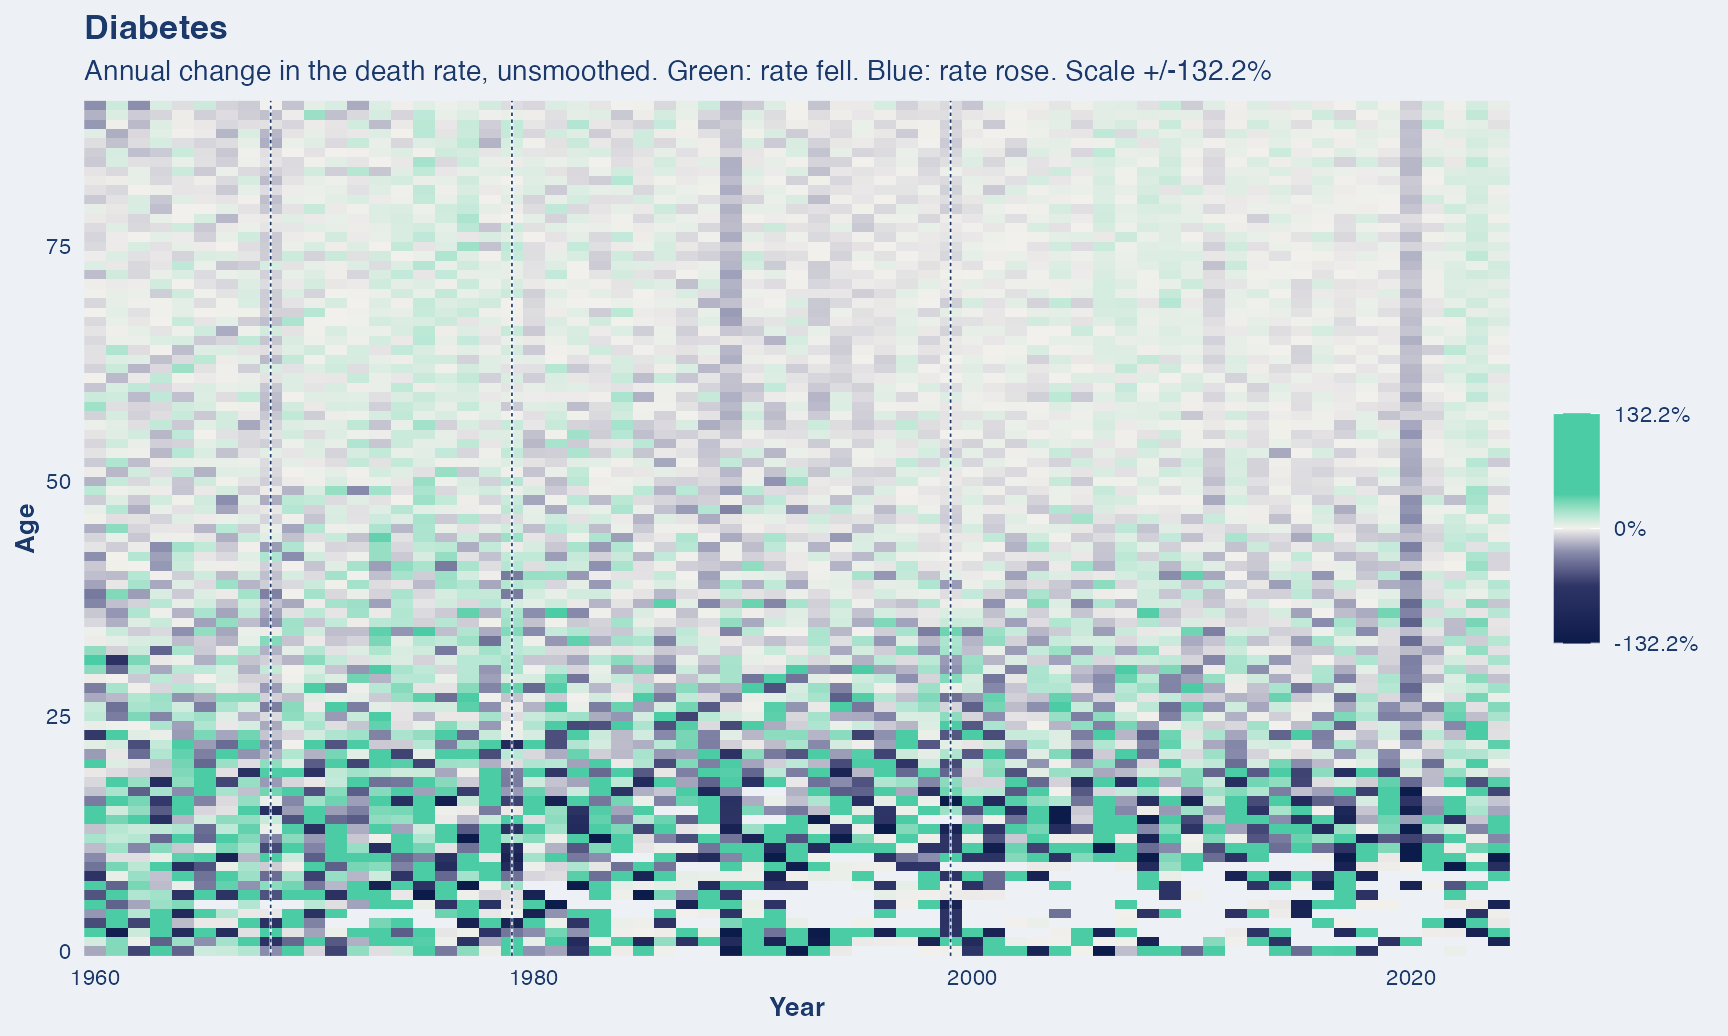
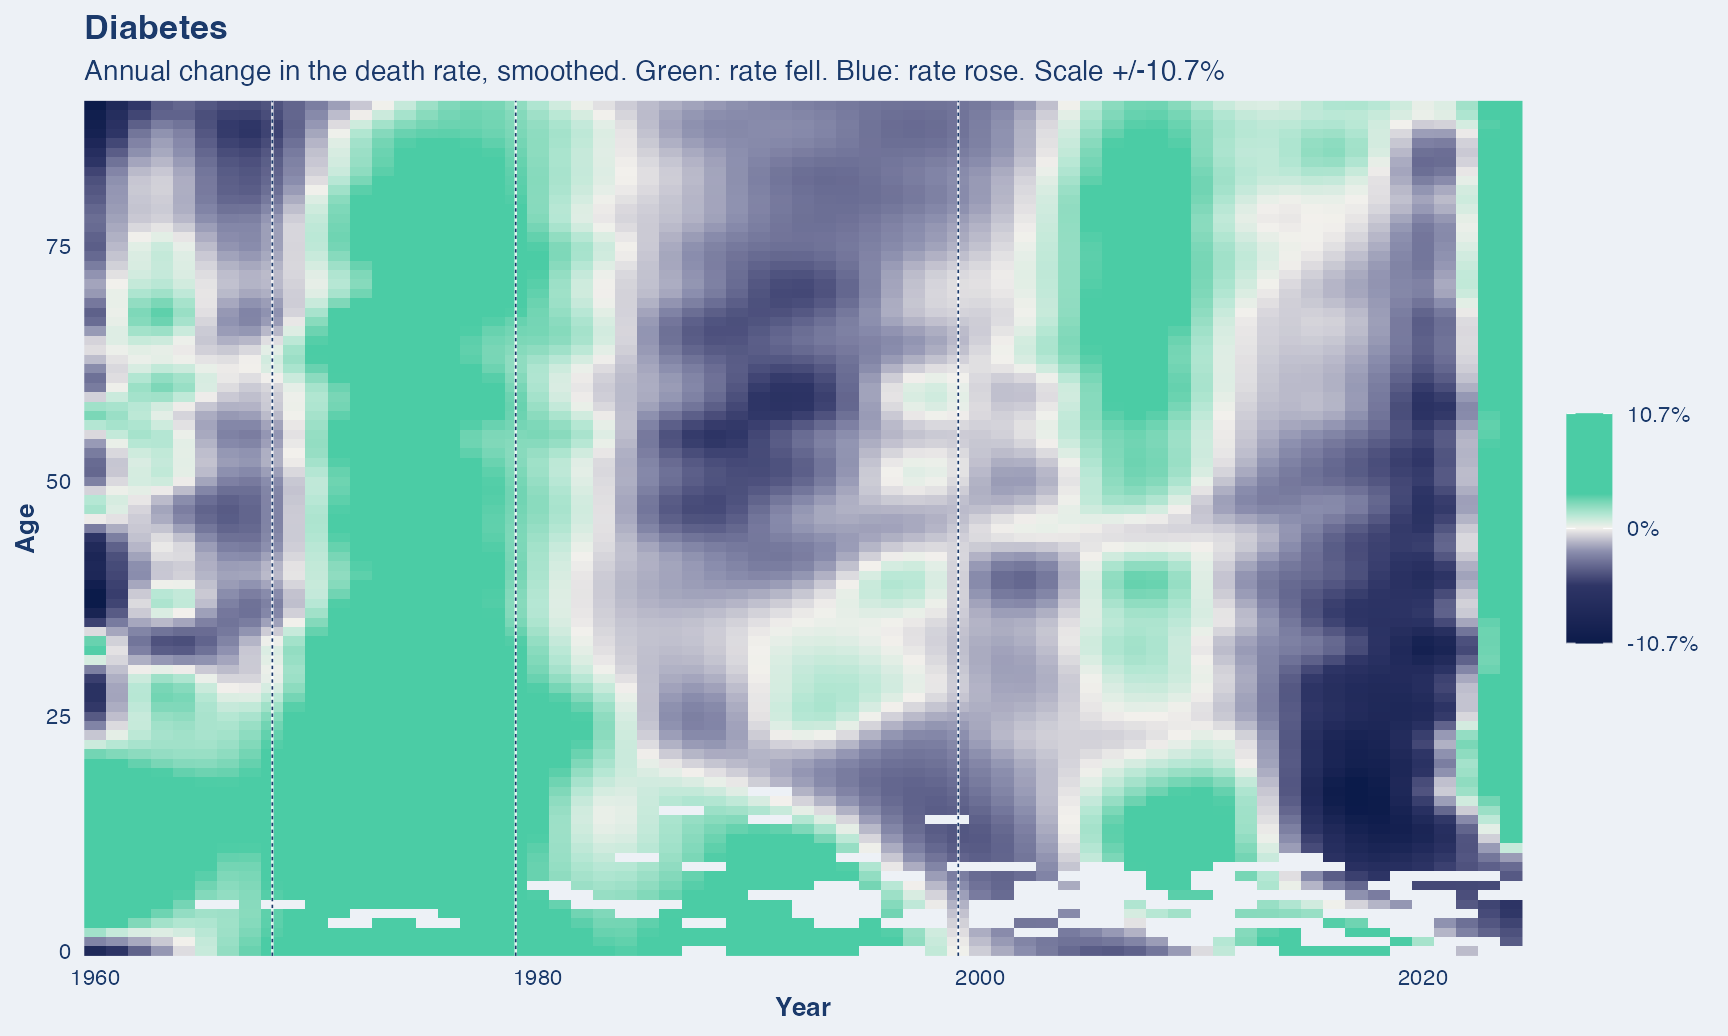
What this covers. Diabetes recorded as the condition that started the chain of events leading to death.
Years shown. 1959 to 2024. A single ICD category that carries across all four revisions.
Dashed vertical lines mark ICD revision boundaries (1968, 1979, 1999). A step at one of these is the classification changing, not necessarily mortality.
One source throughout. Deaths for every year come from the NBER mirror of the NCHS Multiple Cause-of-Death files, so nothing in this series is a change of data source.
Chronic lower respiratory
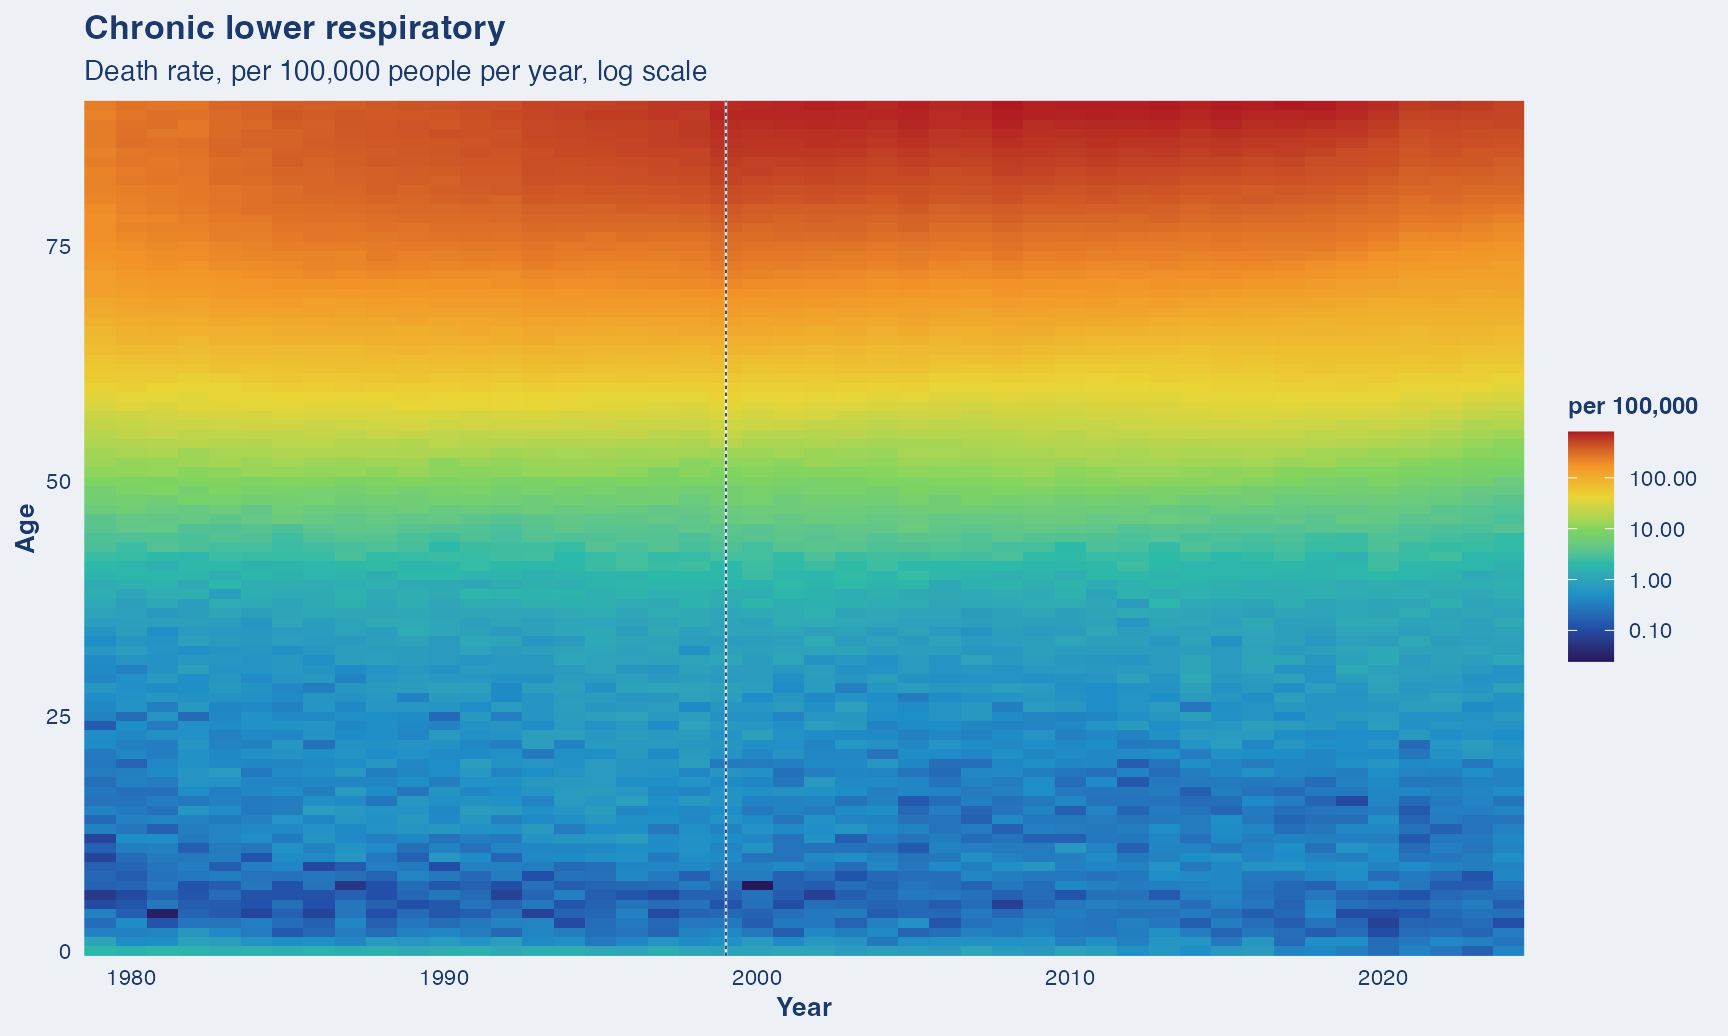
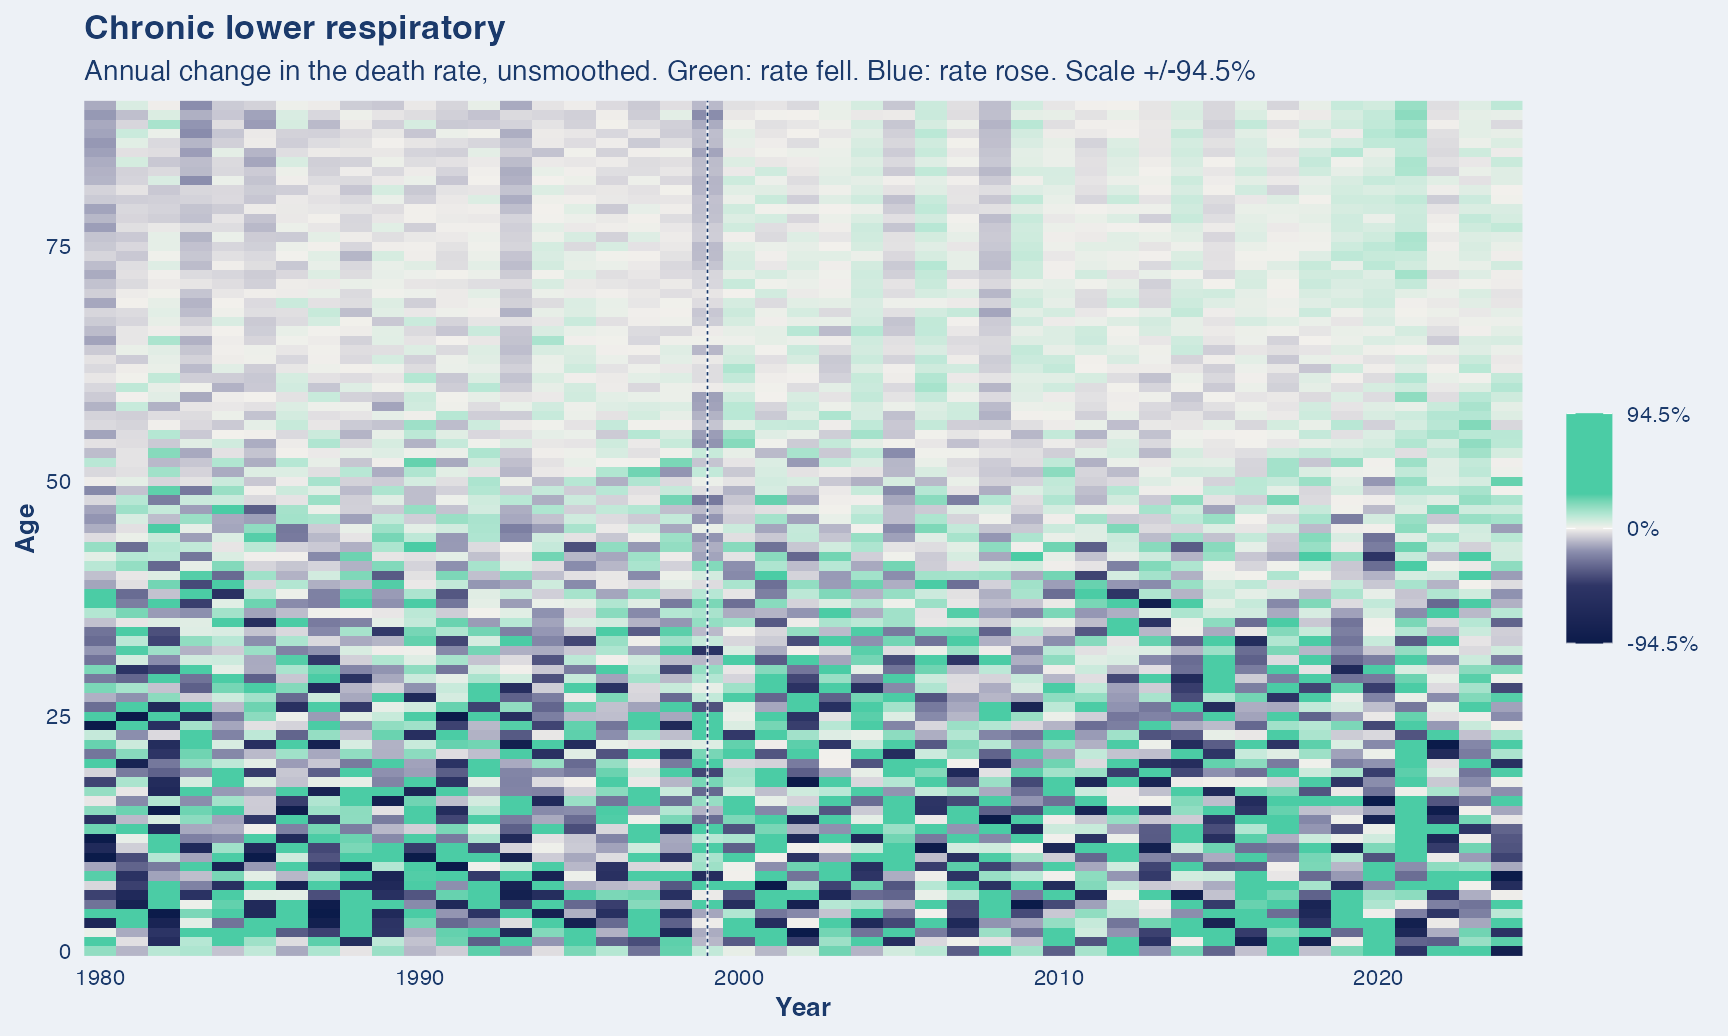
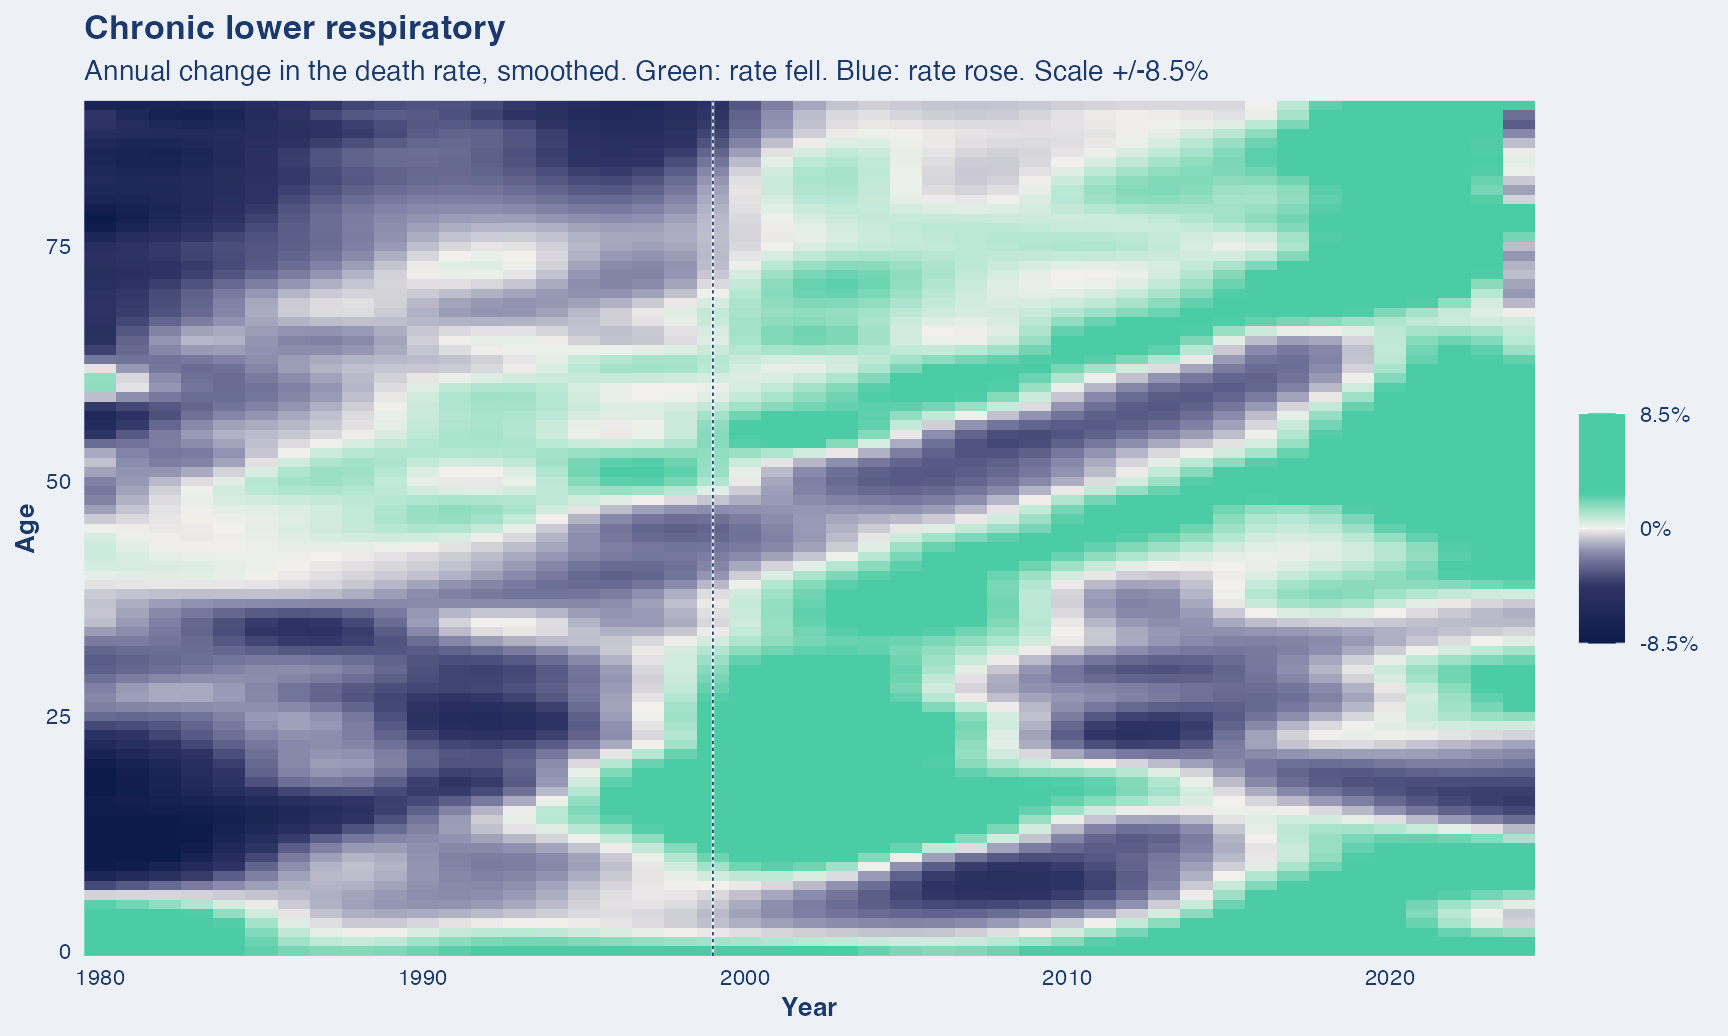
What this covers. Emphysema, chronic bronchitis, asthma and related long-term lung disease.
Years shown. 1979 to 2024. Before ICD-9 (1979) the groupings for bronchitis, emphysema and asthma differ too much to compare: the share of all deaths steps 1.0% to 1.7% to 2.6% across the two earlier boundaries. The series therefore starts at 1979.
Dashed vertical lines mark ICD revision boundaries (1999). A step at one of these is the classification changing, not necessarily mortality.
One source throughout. Deaths for every year come from the NBER mirror of the NCHS Multiple Cause-of-Death files, so nothing in this series is a change of data source.
Alcoholic liver disease
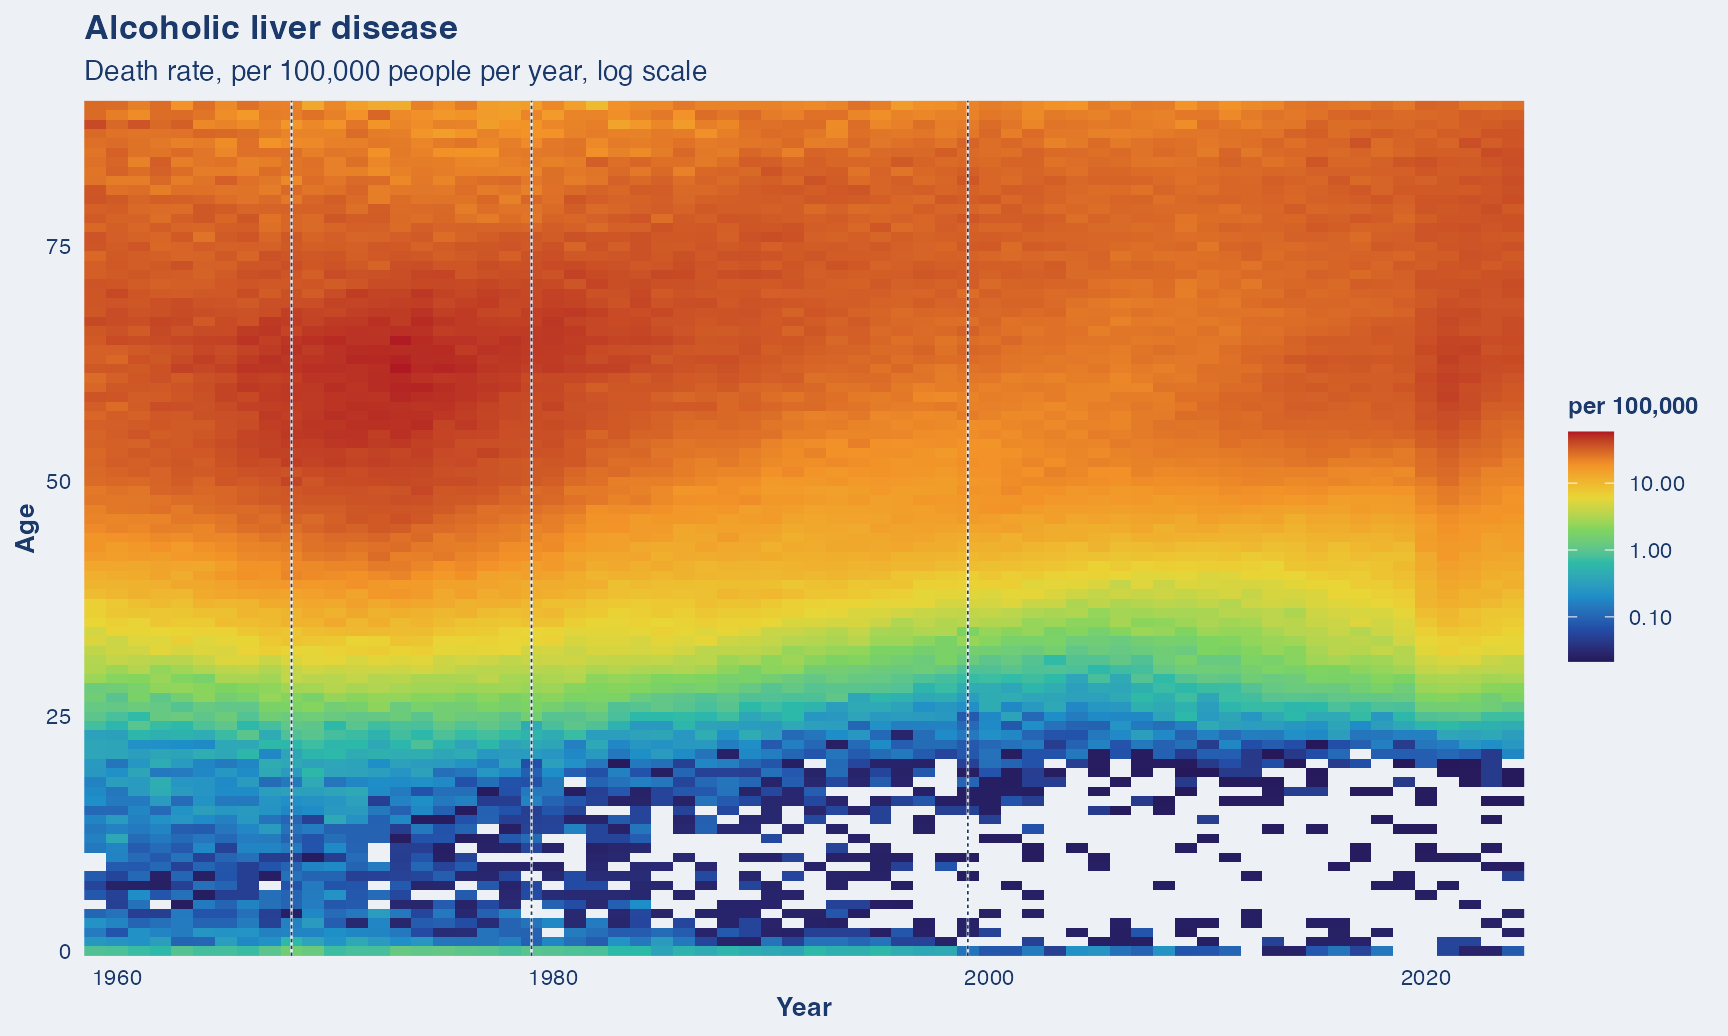
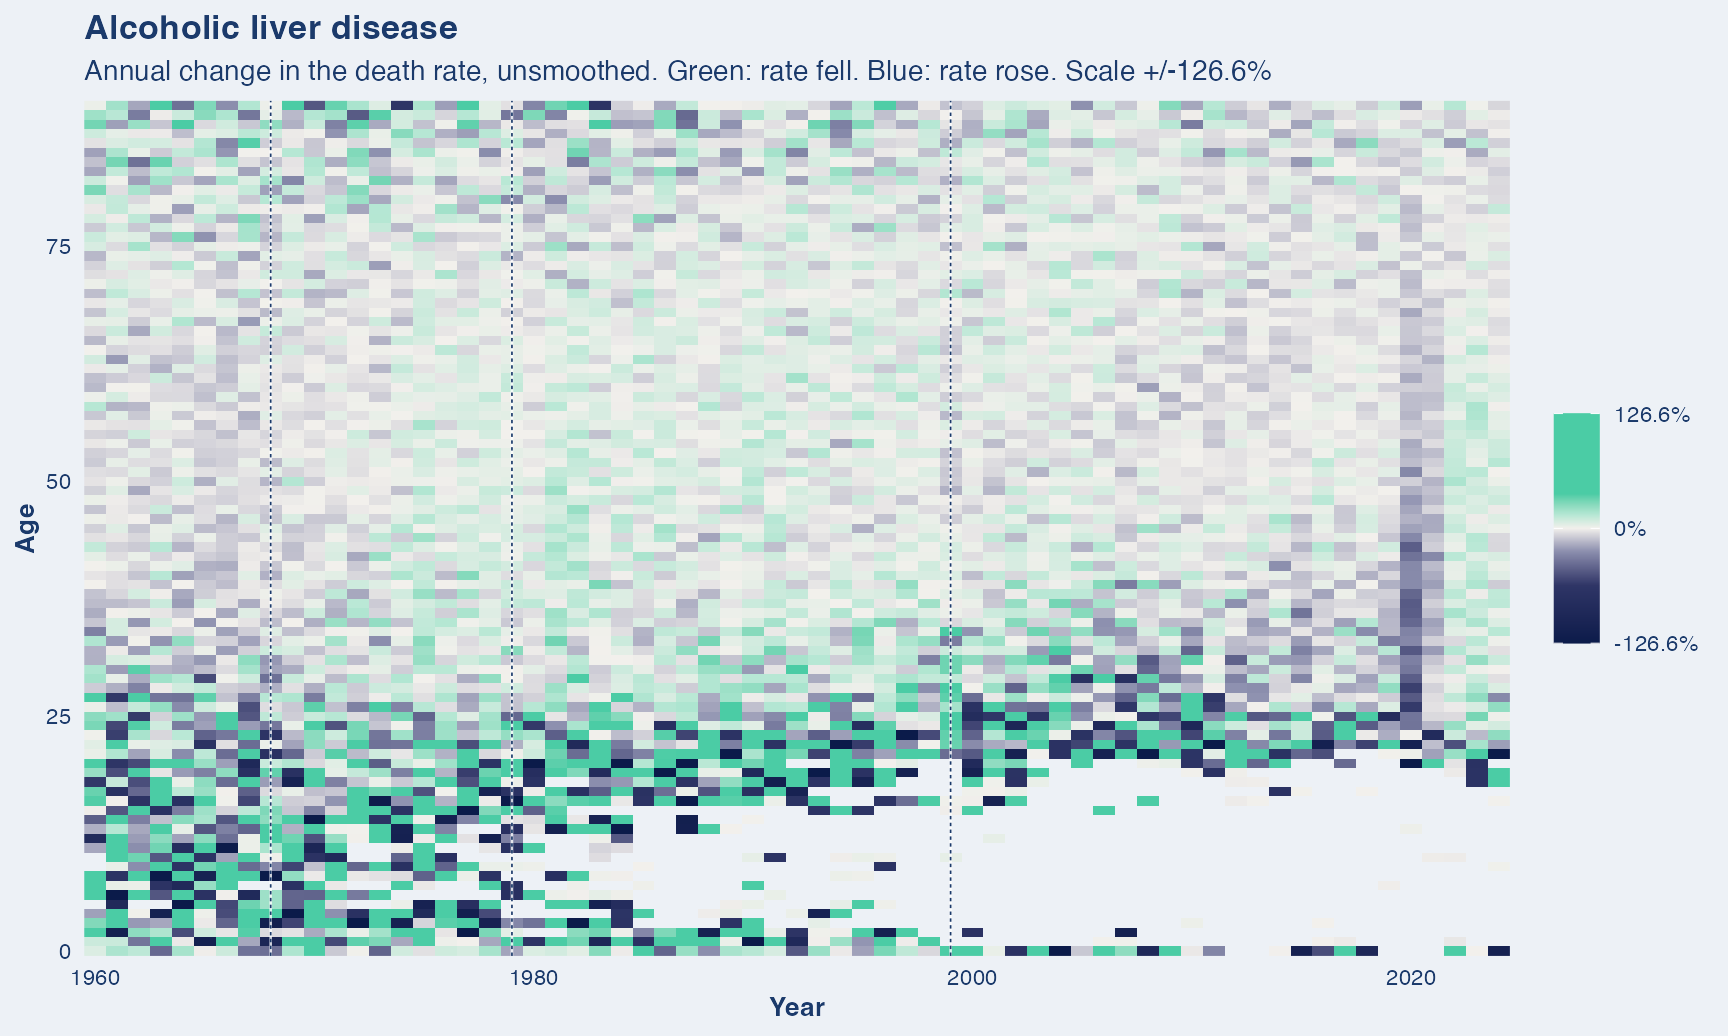
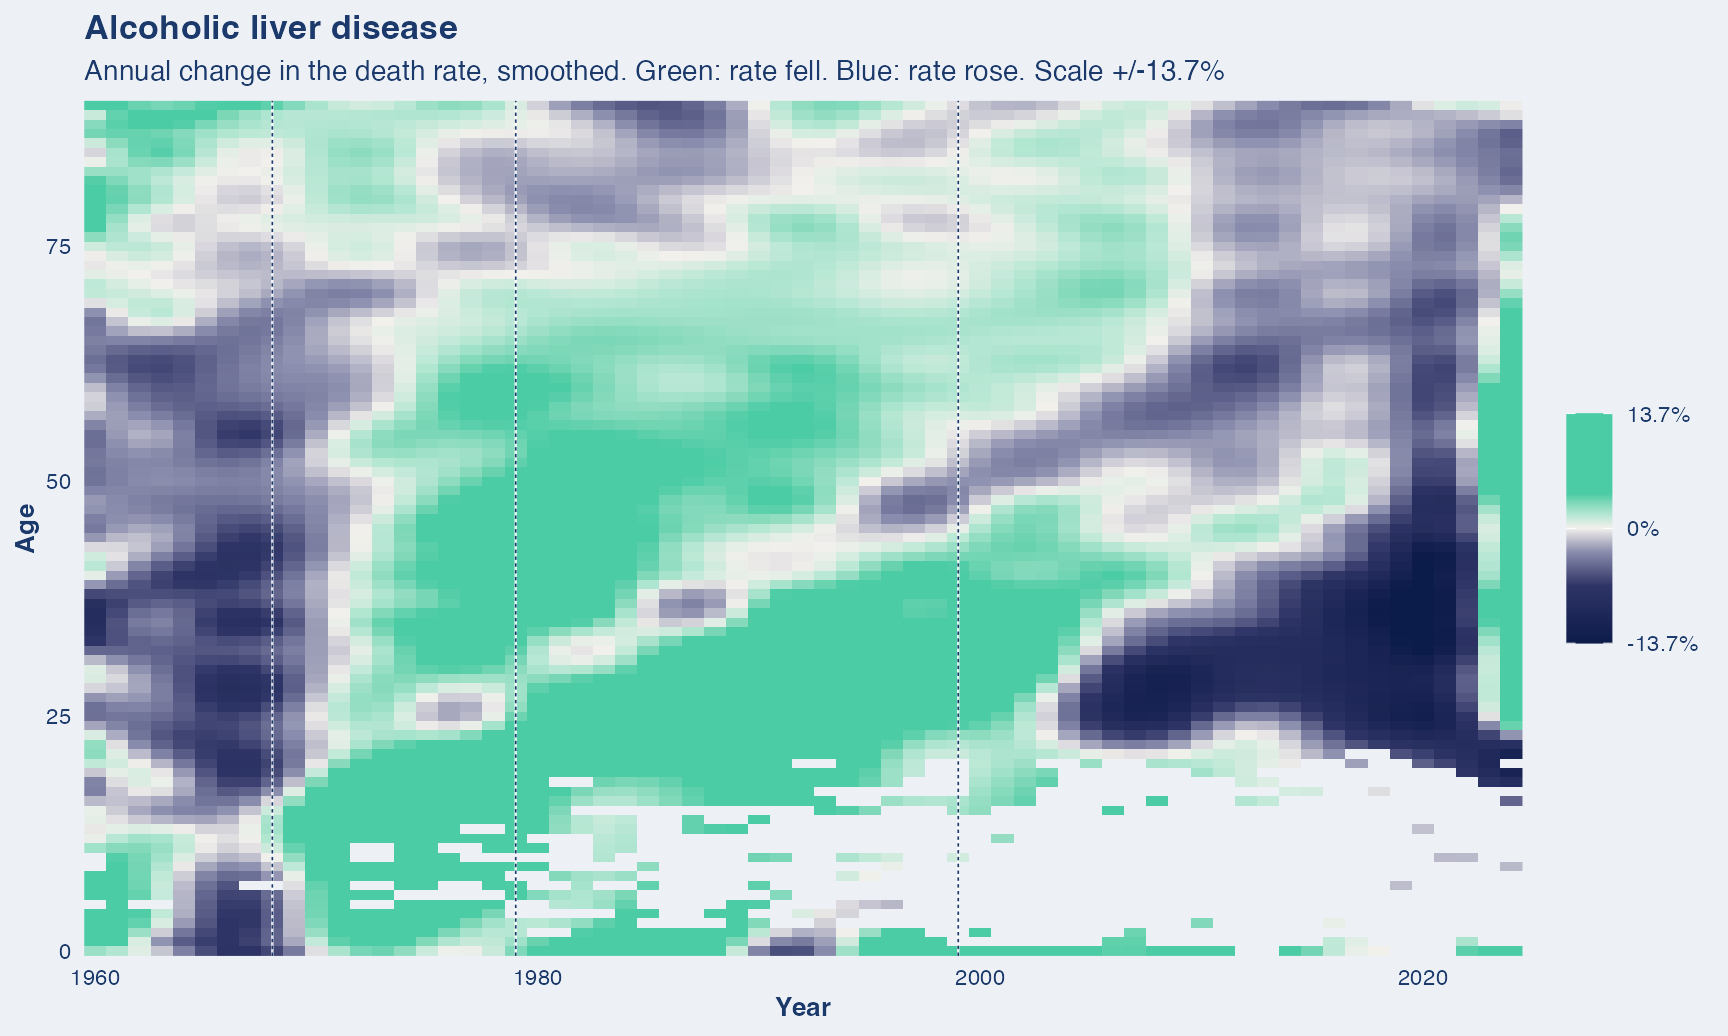
What this covers. Cirrhosis and other liver damage attributed to alcohol.
Years shown. 1959 to 2024. A single ICD category, stable across the revisions.
Dashed vertical lines mark ICD revision boundaries (1968, 1979, 1999). A step at one of these is the classification changing, not necessarily mortality.
One source throughout. Deaths for every year come from the NBER mirror of the NCHS Multiple Cause-of-Death files, so nothing in this series is a change of data source.
Dementia & Alzheimer’s
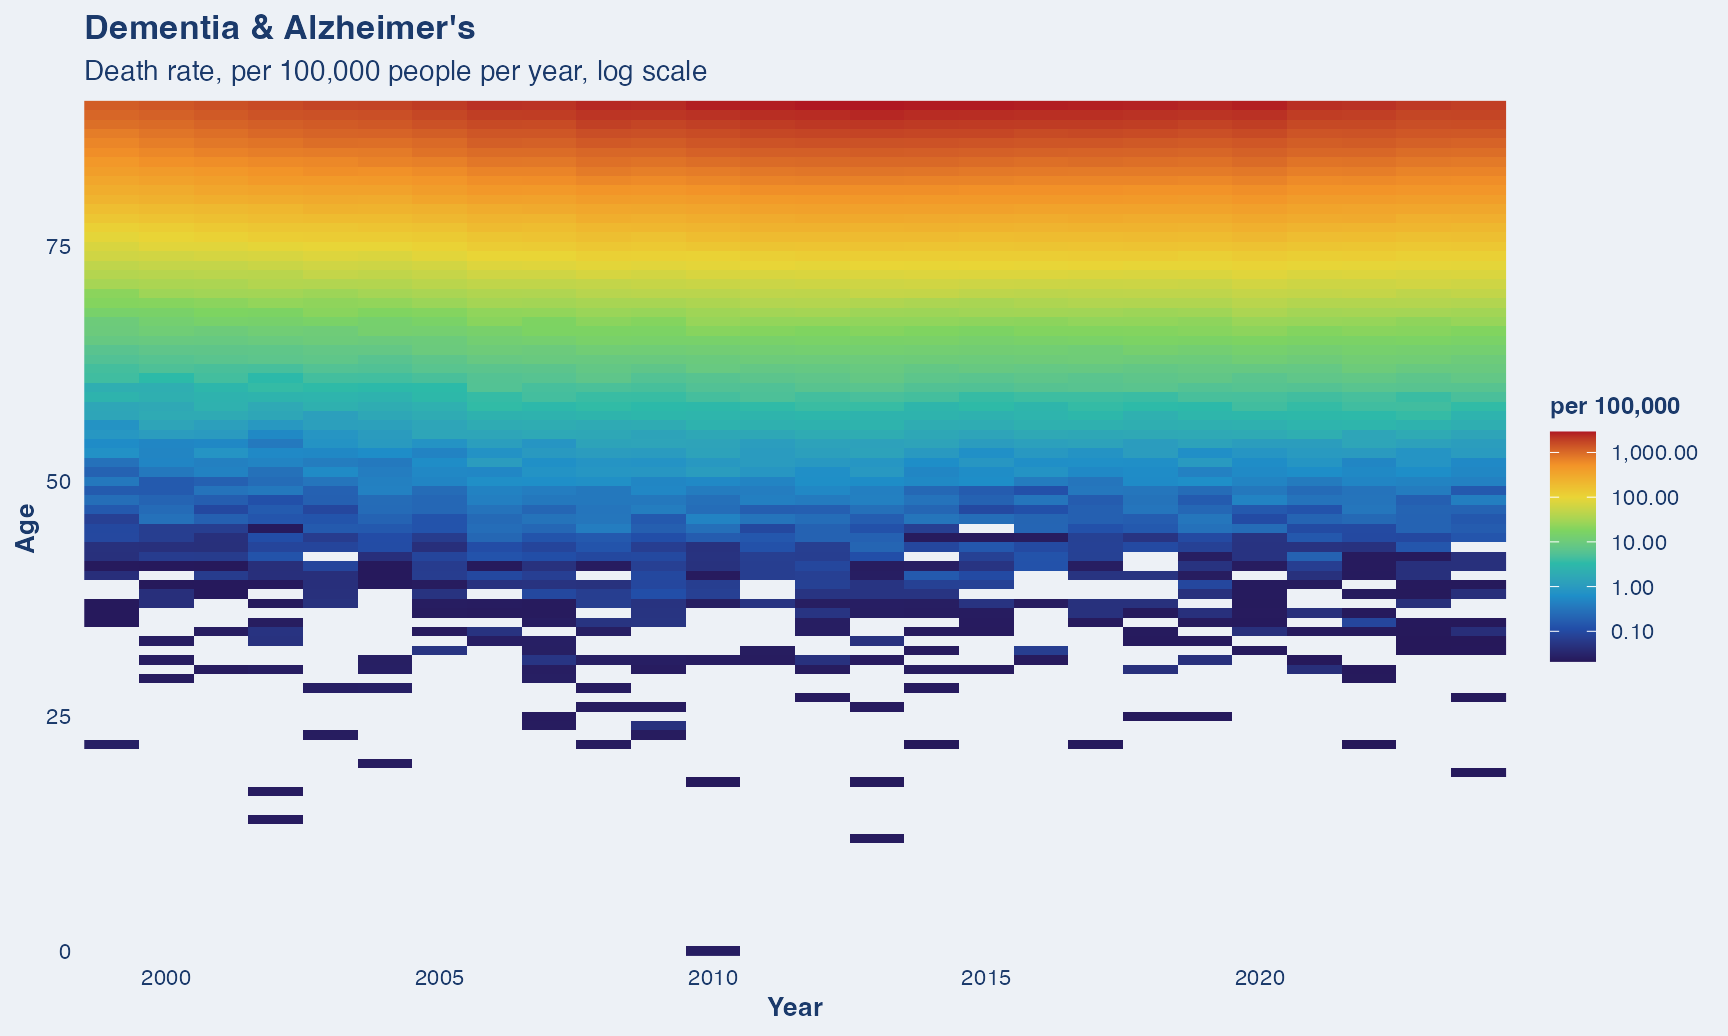
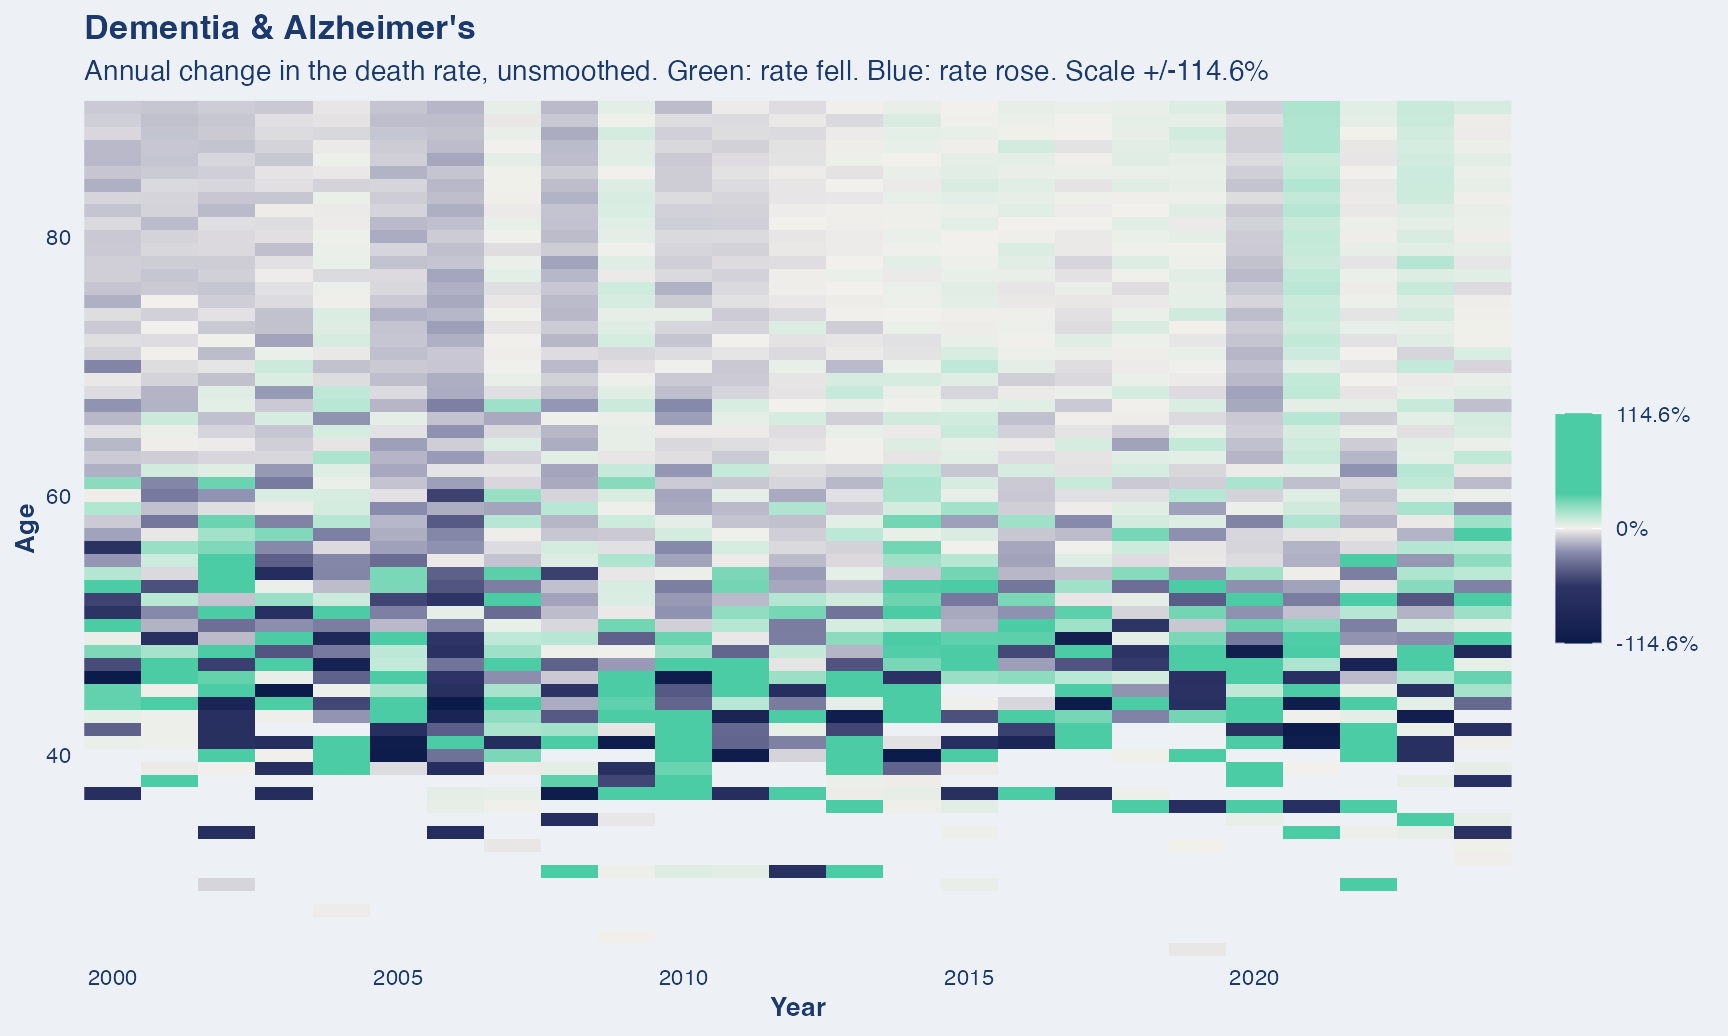
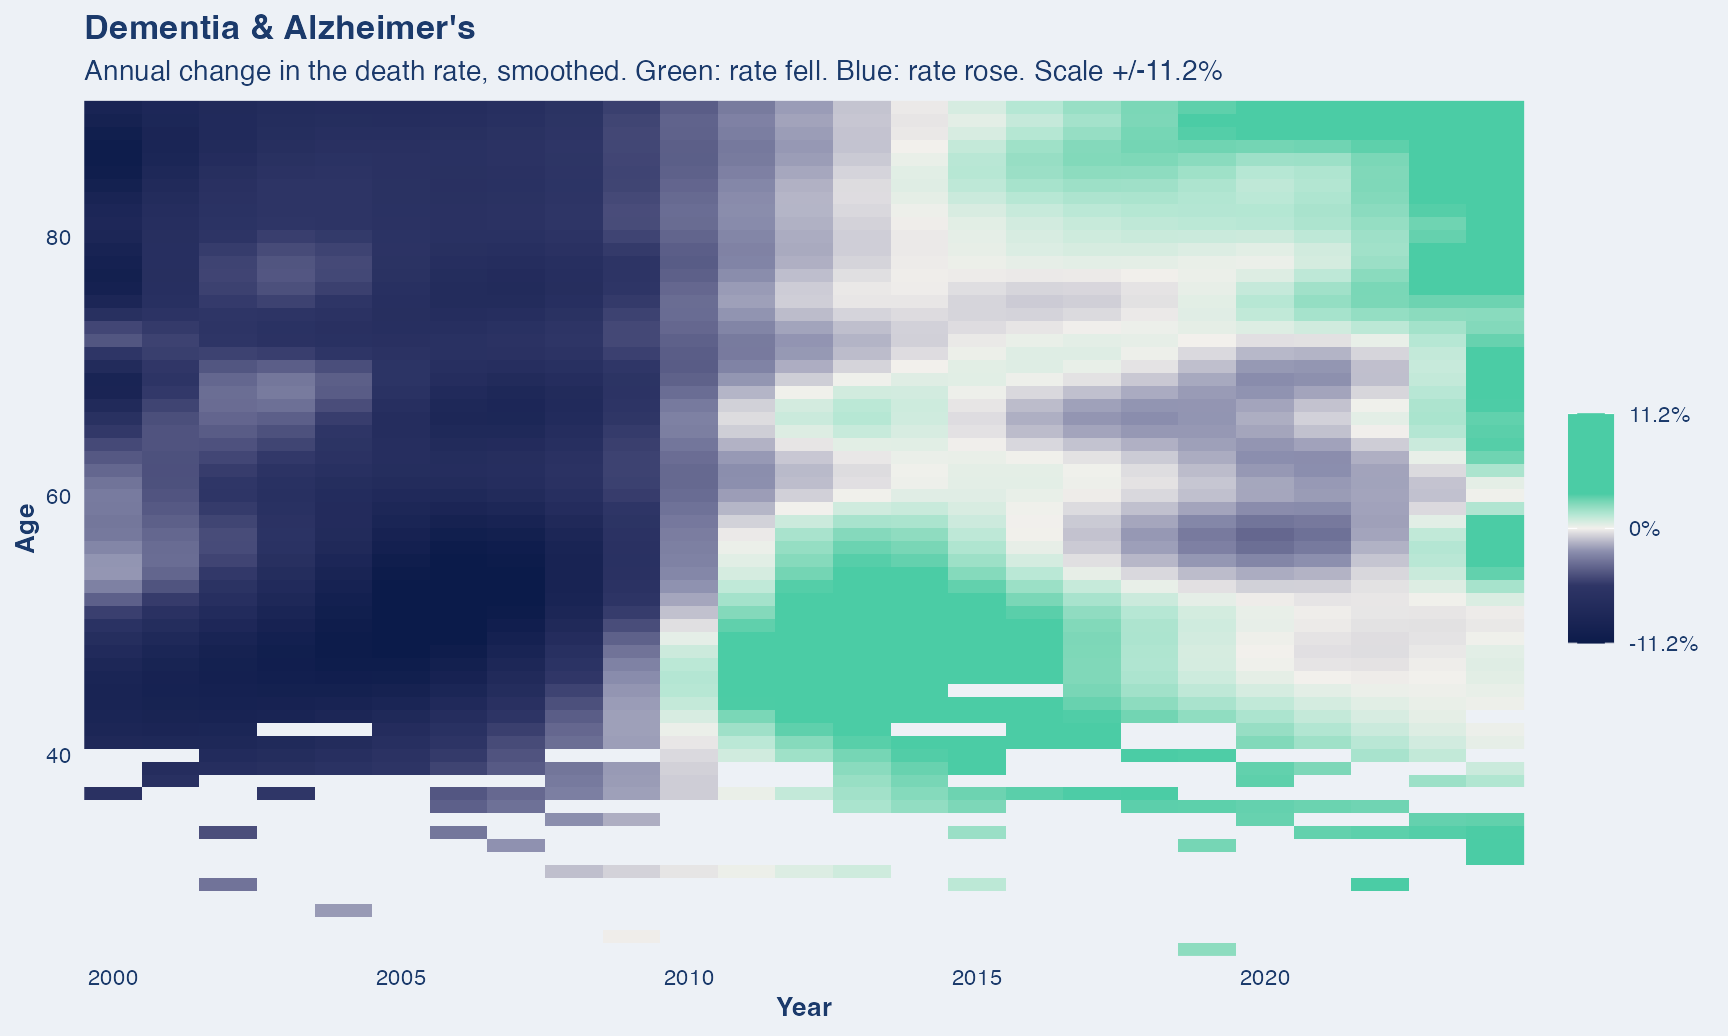
What this covers. Alzheimer’s disease and other dementias.
Years shown. 1999 to 2024. Codeable earlier, but rarely recorded as the underlying cause before ICD-10 (1999). An earlier series would measure certification practice, not disease.
One source throughout. Deaths for every year come from the NBER mirror of the NCHS Multiple Cause-of-Death files, so nothing in this series is a change of data source.
Combinations
Two groupings that are not single ICD chapters but are worth seeing whole.
Deaths of despair is drug poisoning, suicide and alcoholic liver disease taken together. The members overlap, since a suicide by overdose is both a drug poisoning and a suicide, so the aggregation counts each death once rather than summing the three series.
Cancer + cardiovascular is the two largest blocks together, over half of all deaths in every year here.
Deaths of despair
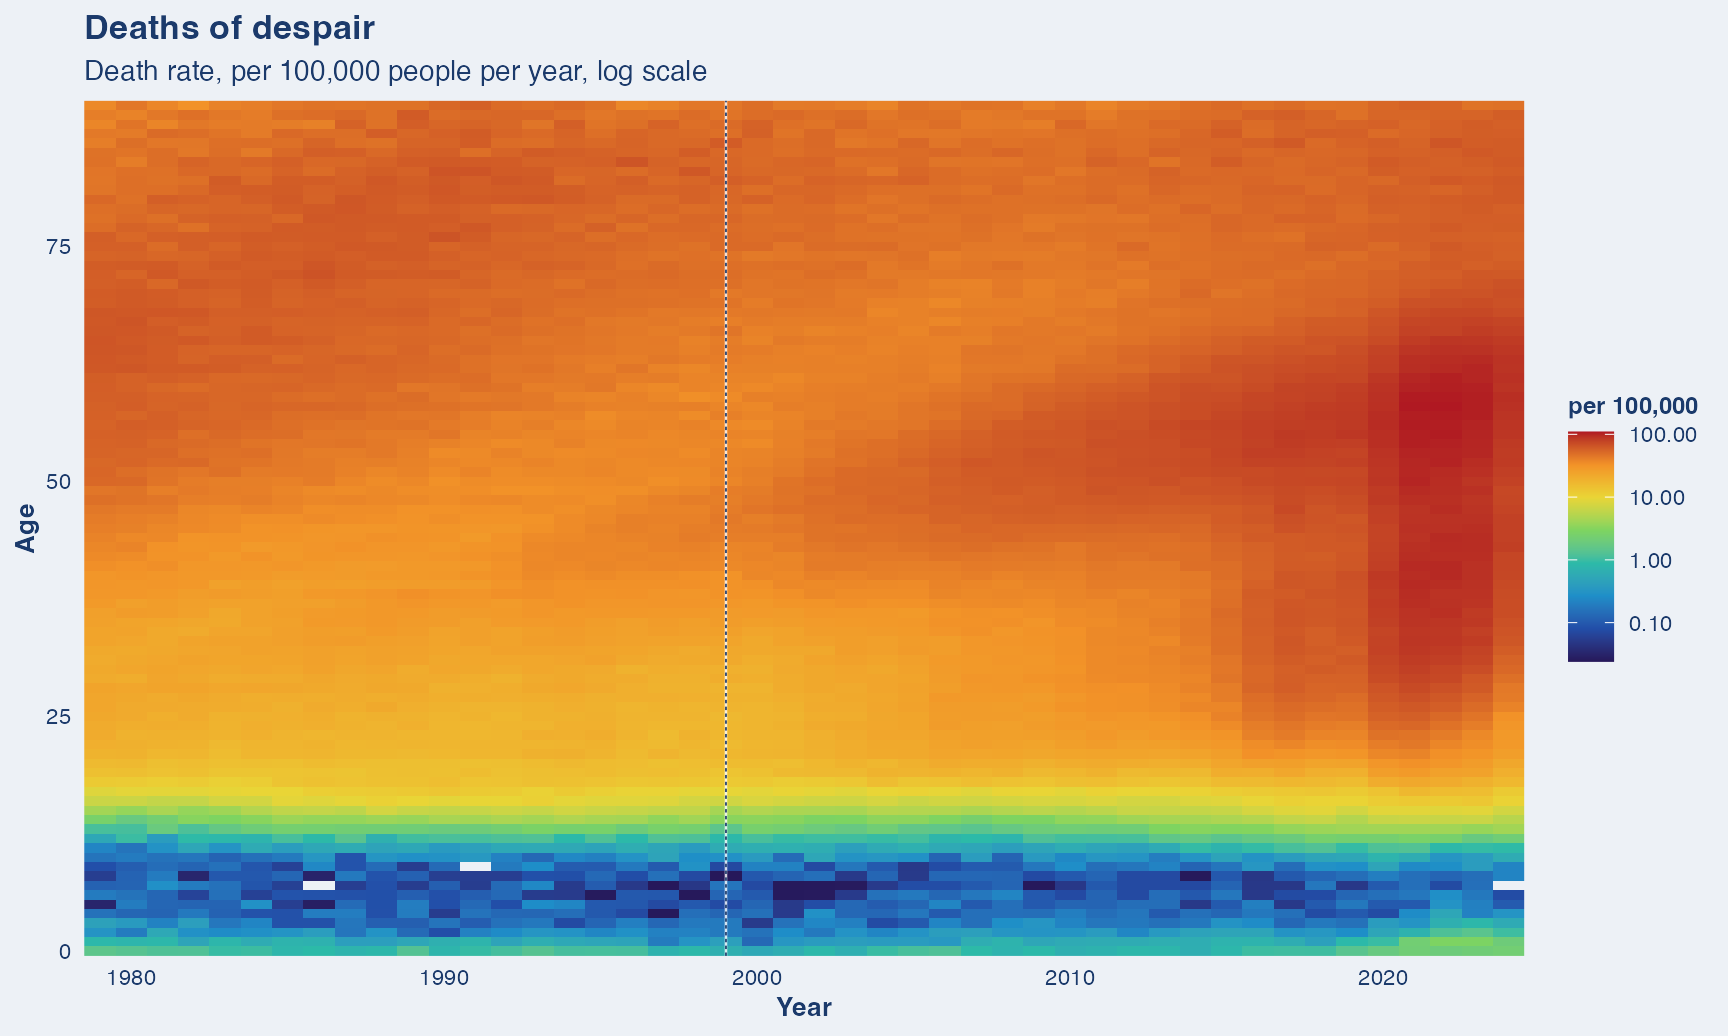
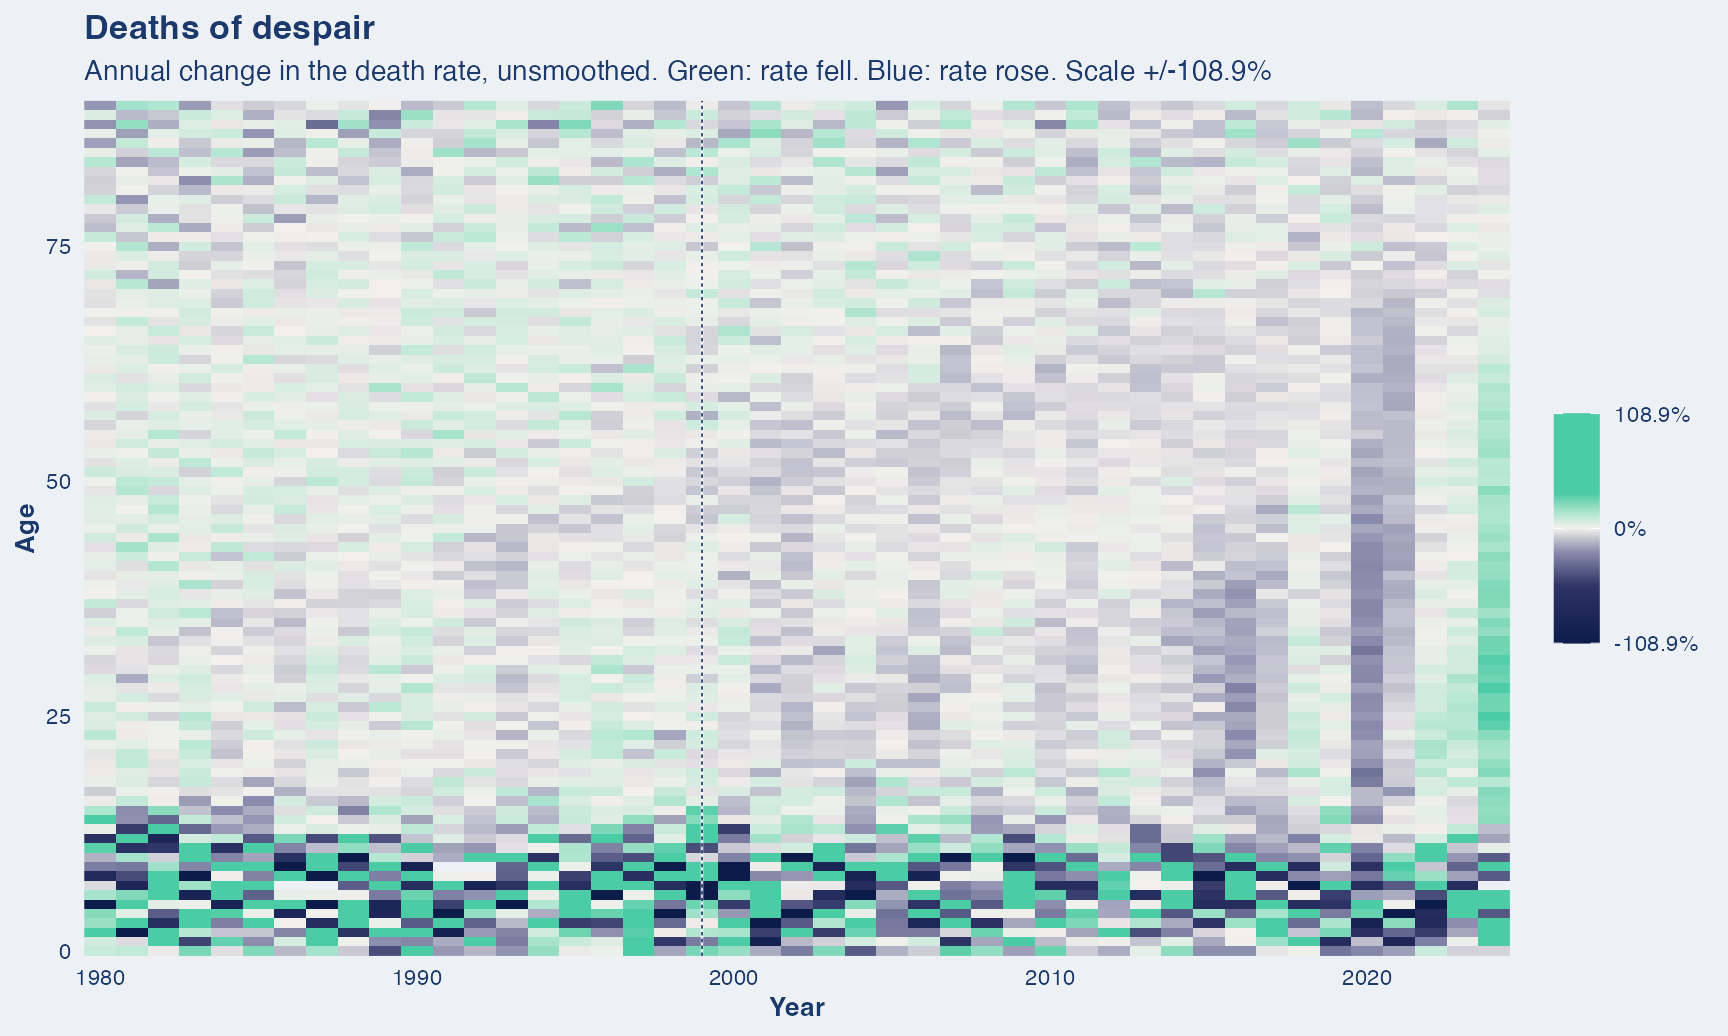
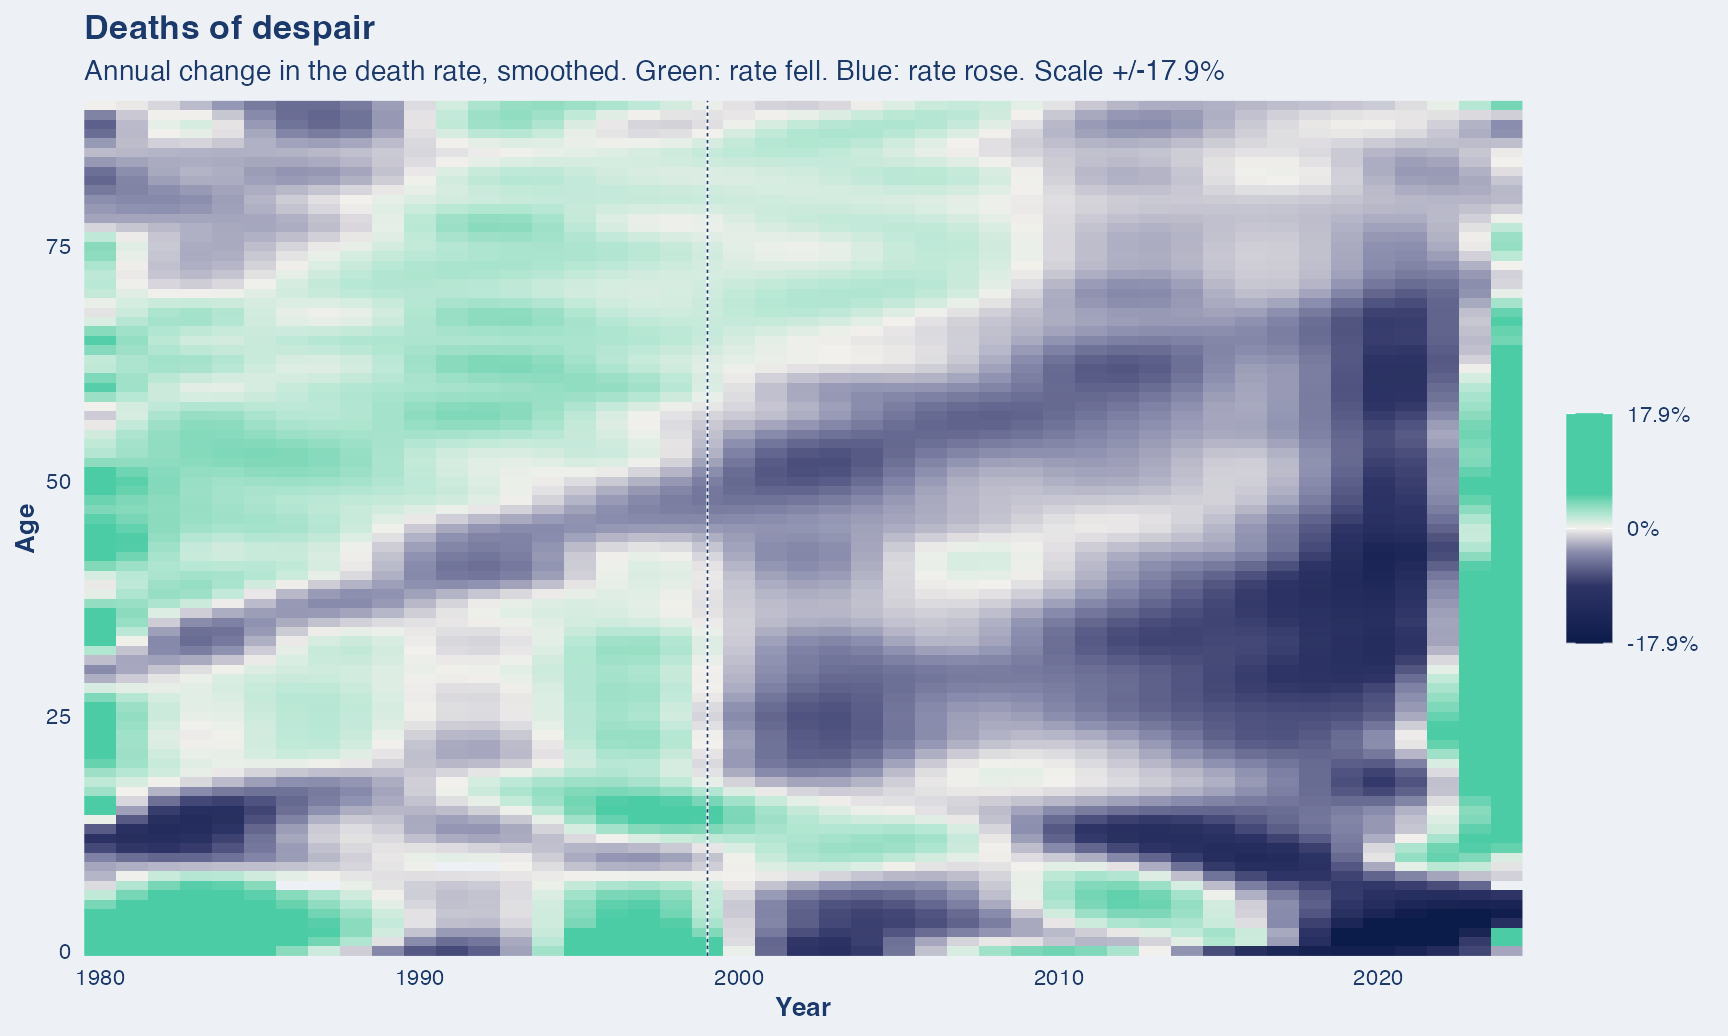
What this covers. Drug poisoning, suicide and alcoholic liver disease taken together. Each death counted once, so an overdose suicide is not double counted.
Years shown. 1979 to 2024. Starts at 1979, the first year drug poisoning is available. The other two members reach back to 1959.
Dashed vertical lines mark ICD revision boundaries (1999). A step at one of these is the classification changing, not necessarily mortality.
One source throughout. Deaths for every year come from the NBER mirror of the NCHS Multiple Cause-of-Death files, so nothing in this series is a change of data source.
Cancer + cardiovascular
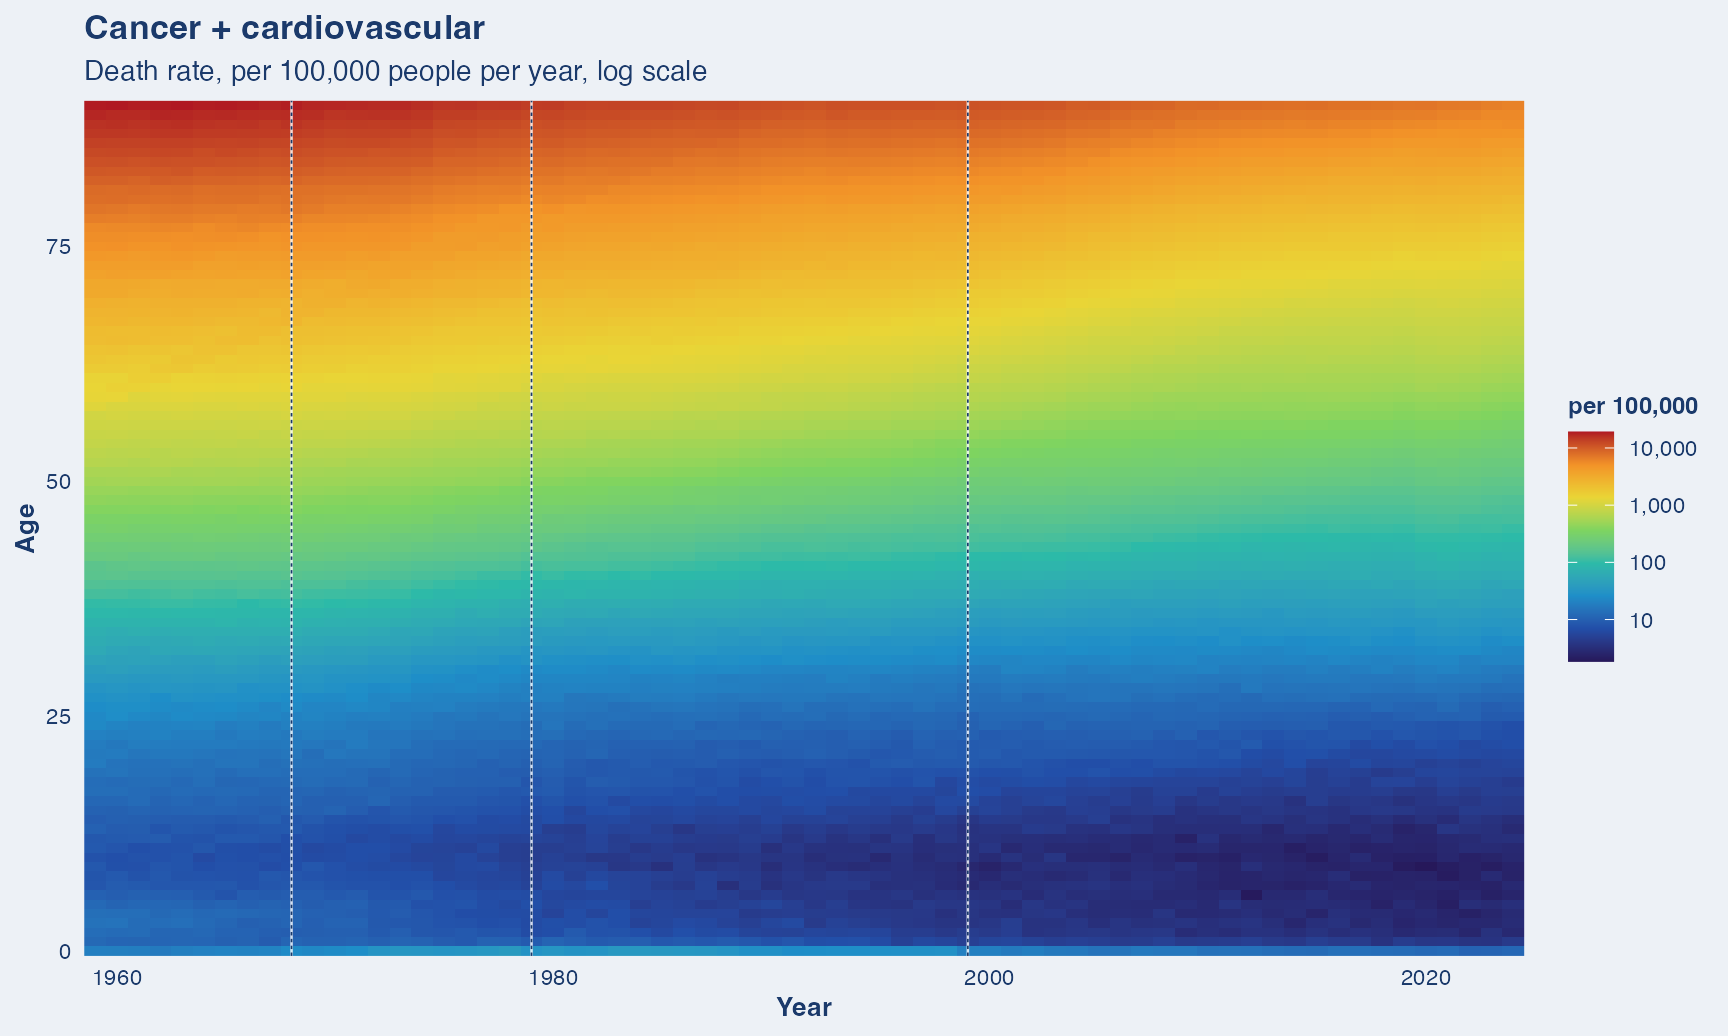
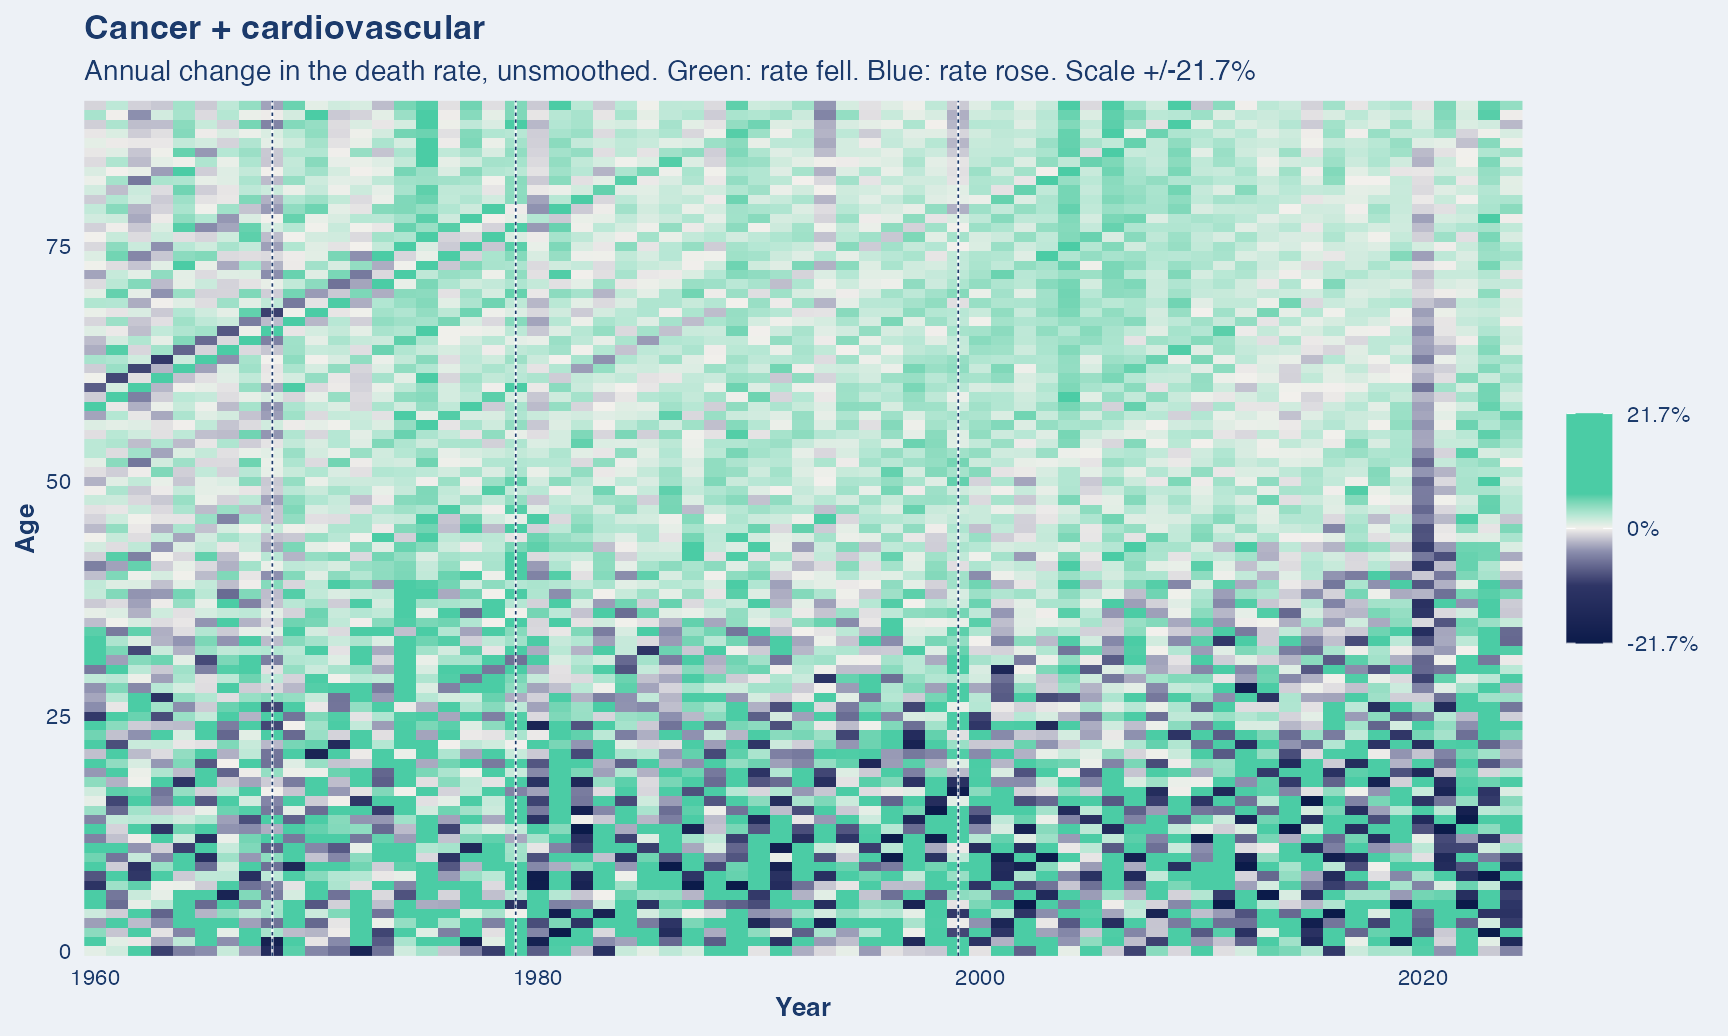
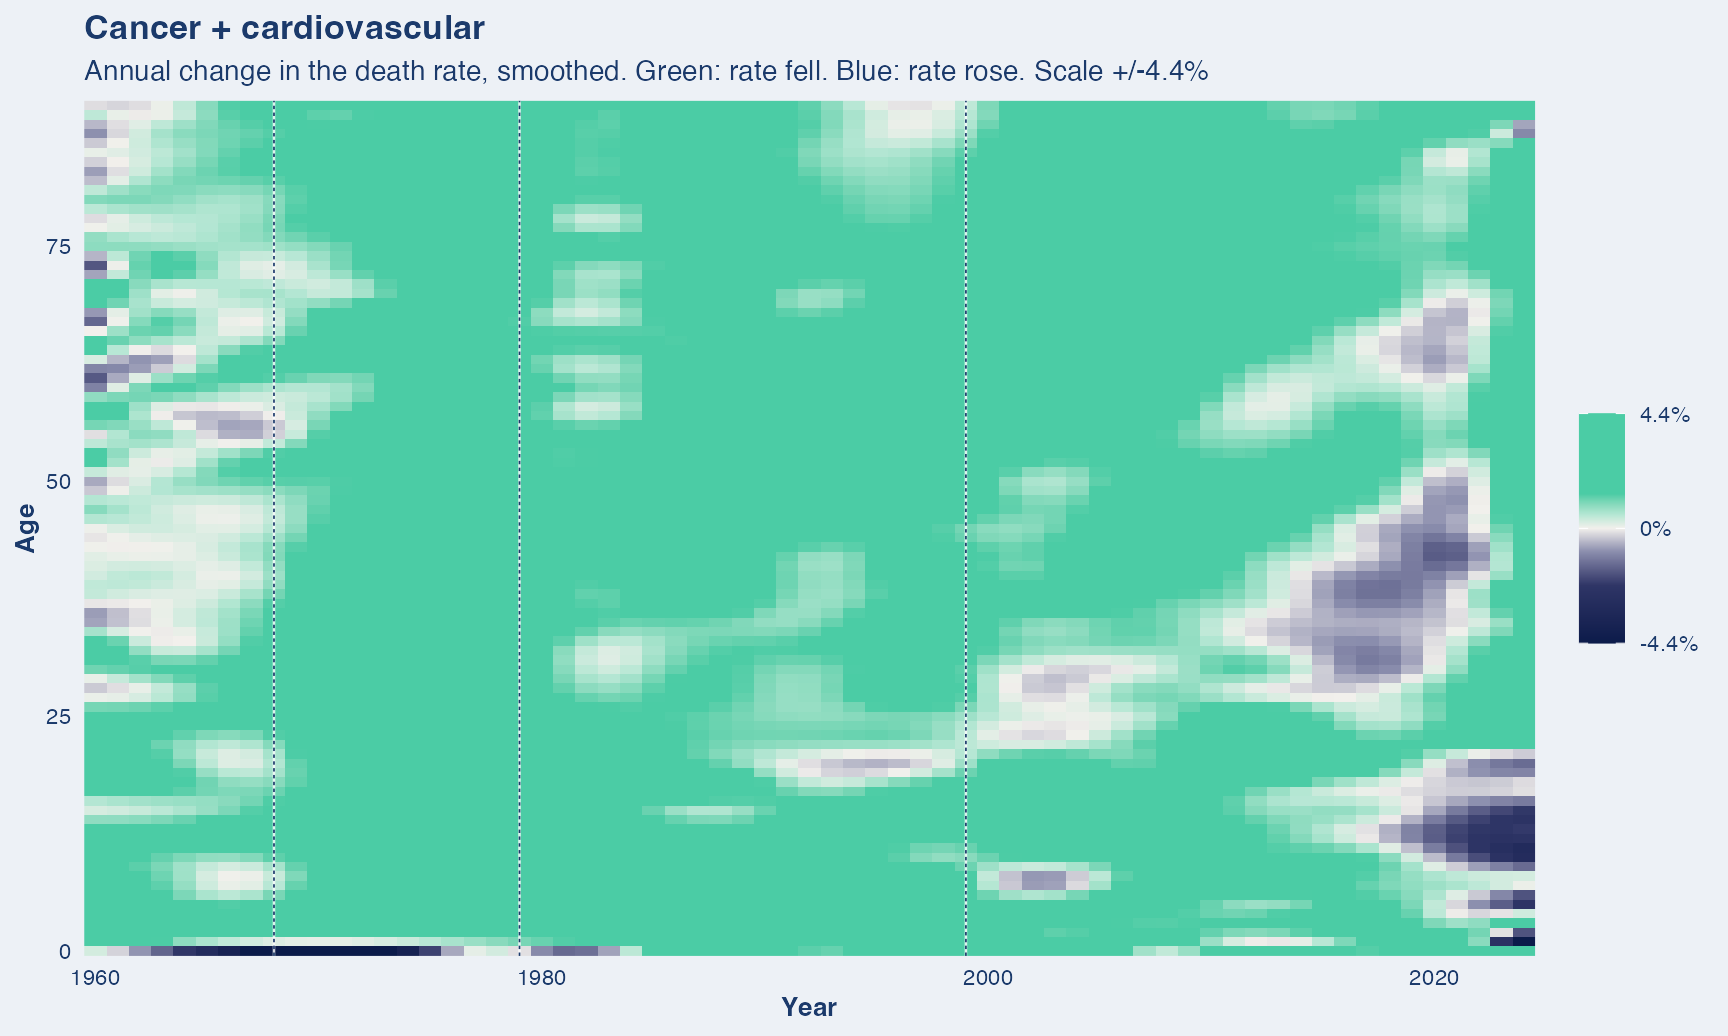
What this covers. The two largest disease groups together, over half of all deaths in every year here.
Years shown. 1959 to 2024. Both members carry the full span, so the combination does too.
Dashed vertical lines mark ICD revision boundaries (1968, 1979, 1999). A step at one of these is the classification changing, not necessarily mortality.
One source throughout. Deaths for every year come from the NBER mirror of the NCHS Multiple Cause-of-Death files, so nothing in this series is a change of data source.
What is not here
War. Military deaths are essentially absent from these files, as they are from HMD. ICD-10 Y36, war operations, records four deaths in 2020 and one in 2021. Y35, legal intervention, runs 700 to 800 a year and is almost entirely police. For war deaths, use a military source.
Obesity. Coded as an underlying cause it comes to 7,915 deaths in 2018, against 84,940 for diabetes. It is recorded as a contributing cause far more often than an underlying one, so the underlying-cause series does not measure it. Diabetes is probably the usable proxy here…?
Anything before 1959. Cause-coded microdata starts there. Earlier years exist only as scanned Vital Statistics tables.
Multiple causes. These files carry every condition listed on the certificate, but everything here uses the single underlying cause, which is what published cause-of-death statistics report.
Two groups of deaths are also dropped before any counting, so the totals here sit a little below the national ones.
Non-resident deaths. Deaths of people whose usual residence was outside the United States are excluded, because the population denominators used here (HMD exposure-to-risk) count US residents only, so a non-resident death has no matching population. The exclusion reads the restatus field, which is only populated in the later files: it removes 9,798 deaths in 2024 (0.32% of the year), between about 7,000 and 10,000 a year across 2018 to 2024 (2023 is the largest at 10,052), and none in years where the field is absent, such as 1959.
Deaths with an unusable age or sex. Records whose age or sex code will not parse are dropped from every series, all-cause included, so they never reach the “All other causes” residual either. A small and falling count: 780 in 1959 (0.047% of that year), a peak of 999 in 1986, and 57 in 2024 (0.002%).
Choosing the “By cause” list
ICD-10 carries roughly 14,000 codes. Most cannot be plotted: a cause with two hundred deaths a year is noise on a Lexis plot, and a cause whose definition moves at 1968, 1979 or 1999 shows the classification changing rather than mortality.
What goes in the “By cause” dropdown list is a subjective choice.
Chapters first. The twelve top-level groups are ICD chapters, drawn so every death falls in exactly one of them. The twelve chapters plus “All other causes” equal all deaths exactly, with nothing unaccounted for.
Two groups sit outside that arithmetic on purpose, because they cut across chapters: dementia spans the nervous system and mental chapters, and deaths of despair spans external causes and digestive disease.
Sub-causes where the numbers are large. Under each chapter sit the specific causes big enough to read at single-year-of-age resolution.
Start years… Each group’s share of all deaths was compared in the year either side of 1968, 1979 and 1999. Where that share moved more than about a quarter, the series is cut short of the boundary rather than plotted across it. The Span column below is the result, and the reasoning for each one is in the CAUSE_FROM block of 04-by-cause/aggregate_causes.py.
The Include column is a judgement about how strongly each group earns its place: *** certainly, ** likely, * marginal, X no.
| Cause | ICD-10 | Span | 2024 deaths | % of 2024 | Nests under | Include |
|---|---|---|---|---|---|---|
| All causes | all | 1959‑2024 | 3,072,609 | 100.00 | *** | |
| Cancer + cardiovascular | C, D00-D09, I | 1959‑2024 | 1,542,336 | 50.20 | combination | ** |
| Cancer | C, D00-D09 | 1959‑2024 | 619,950 | 20.18 | chapter | *** |
| Lung cancer | C33-C34 | 1959‑2024 | 128,760 | 4.19 | Cancer | *** |
| Colorectal cancer | C18-C21 | 1959‑2024 | 55,897 | 1.82 | Cancer | *** |
| Pancreatic cancer | C25 | 1959‑2024 | 51,326 | 1.67 | Cancer | *** |
| Breast cancer | C50 | 1959‑2024 | 43,897 | 1.43 | Cancer | *** |
| Prostate cancer | C61 | 1959‑2024 | 34,815 | 1.13 | Cancer | *** |
| Liver cancer | C22 | 1979‑2024 | 30,532 | 0.99 | Cancer | ** |
| Brain cancer | C71 | 1979‑2024 | 18,024 | 0.59 | Cancer | * |
| Bladder cancer | C67 | 1959‑2024 | 17,396 | 0.57 | Cancer | * |
| Oesophageal cancer | C15 | 1959‑2024 | 16,274 | 0.53 | Cancer | * |
| Leukemia | C91-C95 | 1959‑2024 | 23,740 | 0.77 | Cancer | ** |
| Lymphoma | C81-C86 | 1959‑2024 | 20,601 | 0.67 | Cancer | ** |
| Cancer, site unspecified | C80 | 1999‑2024 | 32,203 | 1.05 | Cancer | X |
| Cardiovascular | I | 1959‑2024 | 922,386 | 30.02 | chapter | *** |
| Heart disease | I00-I09, I11, I13, I20-I51 | 1959‑2024 | 683,476 | 22.24 | Cardiovascular | *** |
| Stroke | I60-I69 | 1959‑2024 | 166,851 | 5.43 | Cardiovascular | *** |
| Respiratory | J | 1959‑2024 | 264,751 | 8.62 | chapter | *** |
| Influenza & pneumonia | J09-J18 | 1959‑2024 | 48,138 | 1.57 | Respiratory | *** |
| Influenza only | J09-J11 | 1959‑2024 | 6,512 | 0.21 | Influenza & pneumonia | ** |
| Pneumonia only | J12-J18 | 1959‑2024 | 41,626 | 1.35 | Influenza & pneumonia | ** |
| Chronic lower respiratory | J40-J47 | 1979‑2024 | 145,643 | 4.74 | Respiratory | *** |
| Asthma | J45-J46 | 1979‑2024 | 3,722 | 0.12 | Chronic lower respiratory | ** |
| Interstitial lung disease | J84 | 1999‑2024 | 22,849 | 0.74 | Respiratory | * |
| Aspiration pneumonitis | J69 | 1979‑2024 | 19,023 | 0.62 | Respiratory | * |
| Nervous system | G | 1959‑2024 | 277,631 | 9.04 | chapter | *** |
| Parkinson’s disease | G20-G21 | 1959‑2024 | 40,919 | 1.33 | Nervous system | ** |
| Other degenerative brain disease | G31 | 1999‑2024 | 74,642 | 2.43 | Nervous system | * |
| Mental & behavioural | F | 1959‑2024 | 131,354 | 4.27 | chapter | ** |
| Dementia & Alzheimer’s | G30, F01-F03 | 1999‑2024 | 224,550 | 7.31 | cuts across | *** |
| Endocrine & metabolic | E | 1959‑2024 | 171,953 | 5.60 | chapter | *** |
| Diabetes | E10-E14 | 1959‑2024 | 94,445 | 3.07 | Endocrine & metabolic | *** |
| Digestive | K | 1959‑2024 | 128,496 | 4.18 | chapter | ** |
| Alcoholic liver disease | K70, K73-K74 | 1959‑2024 | 52,272 | 1.70 | Digestive | ** |
| Genitourinary | N | 1959‑2024 | 76,810 | 2.50 | chapter | ** |
| Chronic kidney disease | N18 | 1999‑2024 | 38,138 | 1.24 | Genitourinary | ** |
| Infectious | A, B | 1959‑2024 | 67,894 | 2.21 | chapter | ** |
| Sepsis | A40-A41 | 1968‑2024 | 40,057 | 1.30 | Infectious | ** |
| HIV/AIDS | B20-B24 | 1987‑2024 | 4,589 | 0.15 | Infectious | ** |
| COVID-19 | U07 | 2020‑2024 | 31,426 | 1.02 | special code | *** |
| External causes | V, W, X, Y | 1959‑2024 | 275,003 | 8.95 | chapter | *** |
| Motor vehicle | V01-V99 | 1959‑2024 | 44,712 | 1.46 | External causes | *** |
| Suicide | X60-X84, Y87.0 | 1959‑2024 | 49,327 | 1.61 | External causes | *** |
| Homicide | X85-Y09 | 1959‑2024 | 19,742 | 0.64 | External causes | *** |
| Drug poisoning | X40-X44, X60-X64, X85, Y10-Y14 | 1979‑2024 | 79,377 | 2.58 | External causes | *** |
| Firearms | W32-W34, X72-X74, X93-X95, Y22-Y24, Y35.0, U01.4 | 1979‑2024 | 44,445 | 1.45 | cuts across | *** |
| Ill-defined | R | 1959‑2024 | 31,756 | 1.03 | chapter | * |
| All other causes | residual | 1959‑2024 | 73,199 | 2.38 | residual | *** |
| Deaths of despair | drug, suicide, K70/K73-K74 | 1979‑2024 | 176,567 | 5.75 | cuts across | ** |
Every code above is the ICD-10 form. The ICD-7, ICD-8 and ICD-9 equivalents for each group are in classify() in 04-by-cause/aggregate_causes.py.
List length and download size
The list above is the full fifty, and the interactive ships every one of them, X included. The “By cause” tab loads a single self-contained payload (out/lexis_causes.json) holding deaths and the smoothed change for all three sexes over each cause’s valid years. How much that payload weighs depends on how far down the Include column the list is drawn. Measured from the shipped file, with the star tiers cumulative so each level contains the one below it:
| Include level | Causes | Payload, raw | Payload, gzipped |
|---|---|---|---|
*** only |
25 | 4.23 MB | 1.50 MB |
** and up |
42 | 6.83 MB | 2.42 MB |
* and up |
49 | 7.69 MB | 2.70 MB |
all, X included (shipped) |
50 | 7.76 MB | 2.73 MB |
A fixed 164 KB (75 KB gzipped) of that is the shared exposure grid and metadata, which ships whatever the cause count. Gzipped is the figure that crosses the wire, since the site is served compressed. Most of the weight sits in the common causes, which are all ***: cutting the list to the twenty-five *** causes roughly halves the payload (2.73 to 1.50 MB gzipped), while dropping only the eight marginal * and X causes saves about 310 KB.
Sources
Deaths. NCHS Multiple Cause-of-Death public-use files, 1959-2024, read from the NBER mirror for every year. Underlying cause only, residents only.
Population. Human Mortality Database (mortality.org), United States, exposure-to-risk 1x1.
Method. Cause groupings, the ICD-7/8/9/10 crosswalk and the validation against published national totals are in 04-by-cause/aggregate_causes.py. The smoother matches notebook 01.