A century of American mortality in one data visualization
On this page
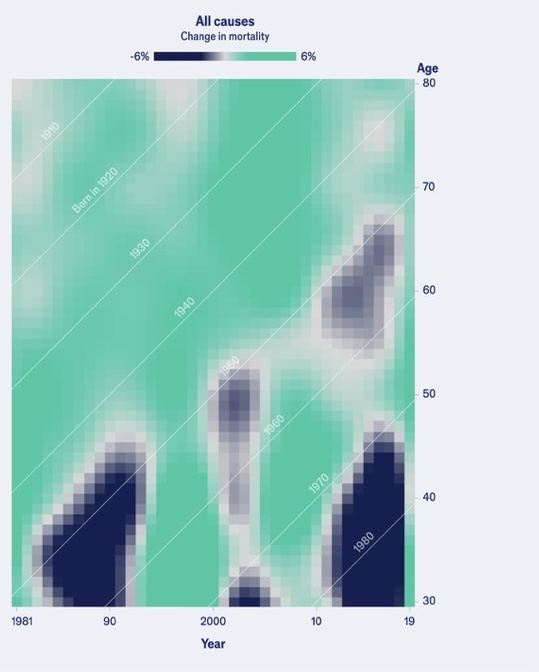
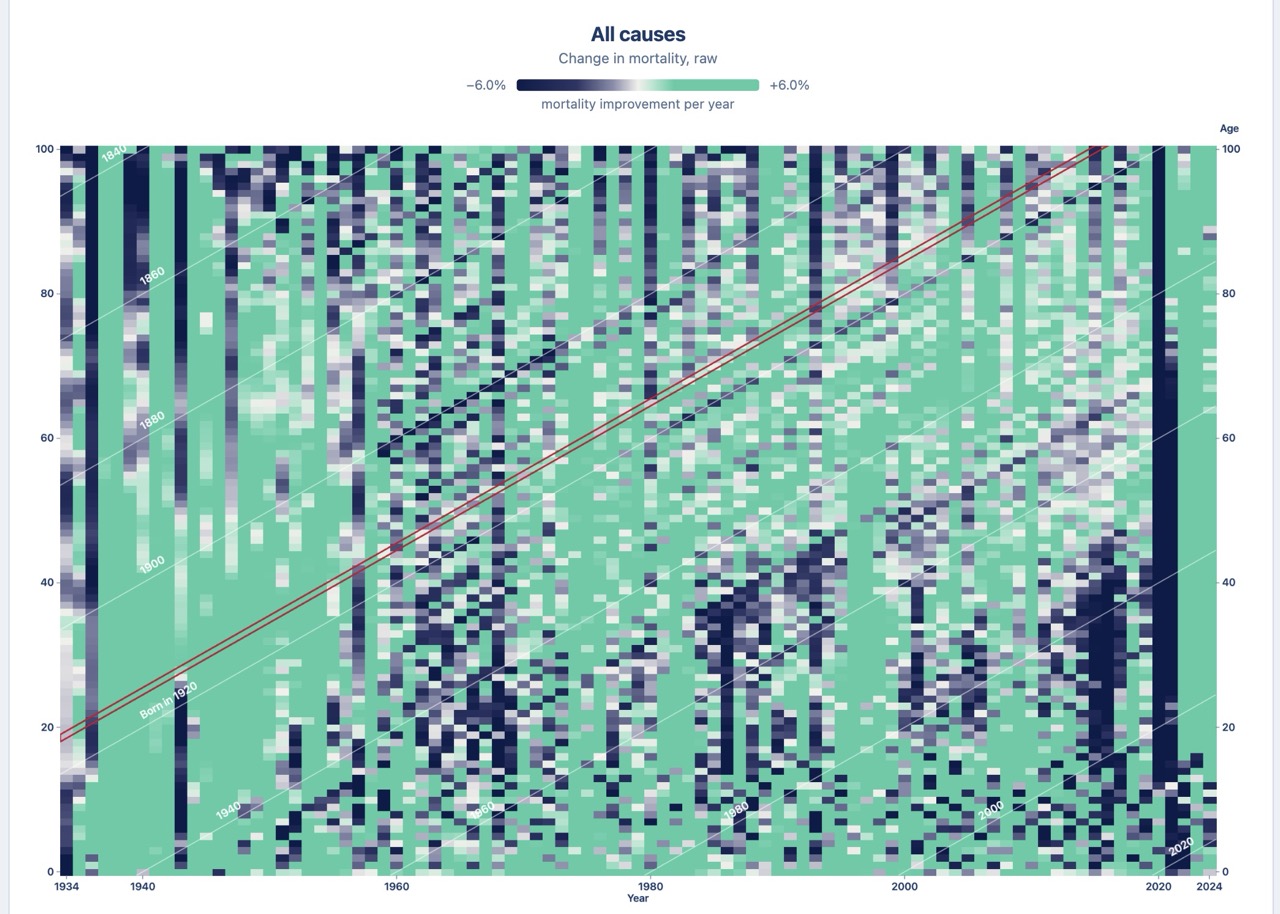
In July, The Economist magazine ran a piece about American mortality rates built around a single plot. The plot is a Lexis diagram: a time series with calendar years along the bottom, age up the side, and a color in every cell showing whether death rates at that age were falling or rising that year. Green (for good) means falling mortality; blue (for bad) means rising death rates.
Because people conveniently age one year for every year that passes, each birth cohort travels across the plot as a diagonal stripe, and you can follow one from birth to old age. Generations, then, are bands of diagonals
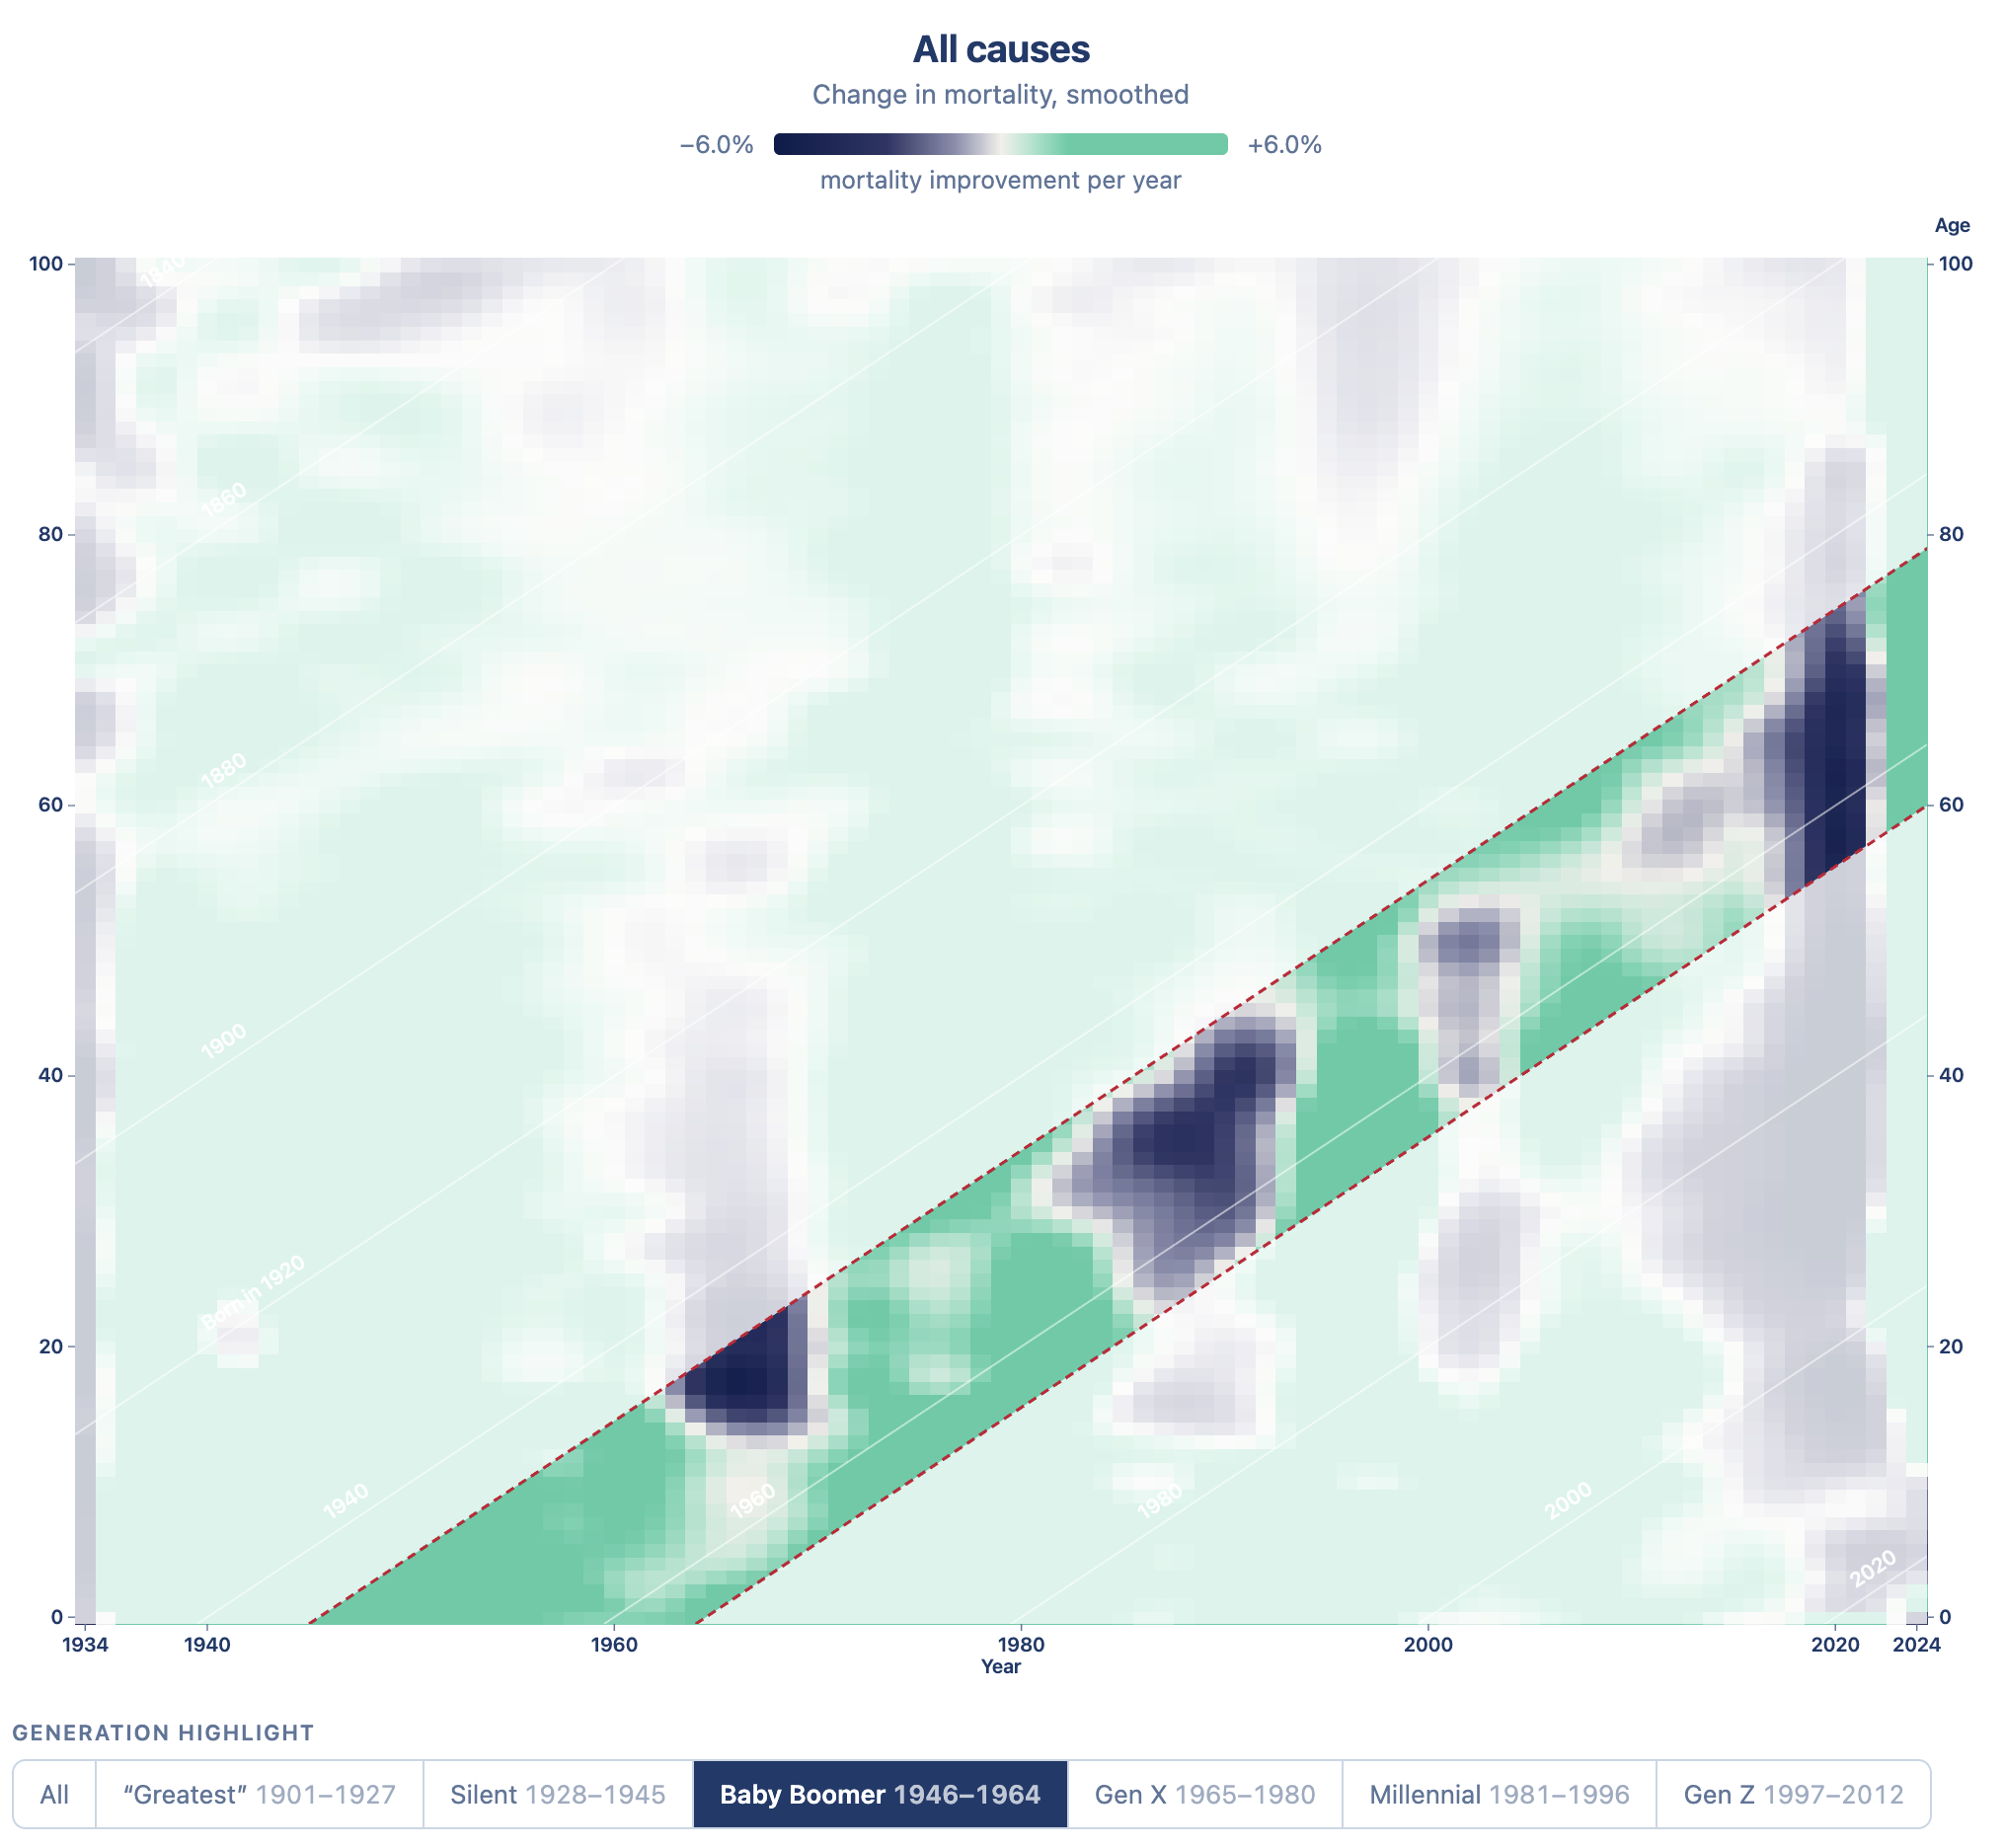
The story it tells is that the baby boomers sit in a band of blue, worsening death rates. The mortality improvements apparent in the generations before them, and to a lesser extent in the generation after them, seems to have skipped the boomers.
It was an interest read, and a plot I hadn’t spent much time with before!
An Instagram Comments Aside
One of my small joys in life is reading an article like this, enjoying a genuinely good piece of data visualization, and then going to Instagram to read the comments.

Replication Project
The plot is a pop-sci presentation of a paper: Abrams, Bramajo, van Raalte, Myrskylä and Mehta, “Insights into US life expectancy stagnation from birth cohort mortality dynamics”, PNAS 2026. I wanted to see whether I could rebuild the figure from public data, so I did, starting from the Human Mortality Database at mortality.org.
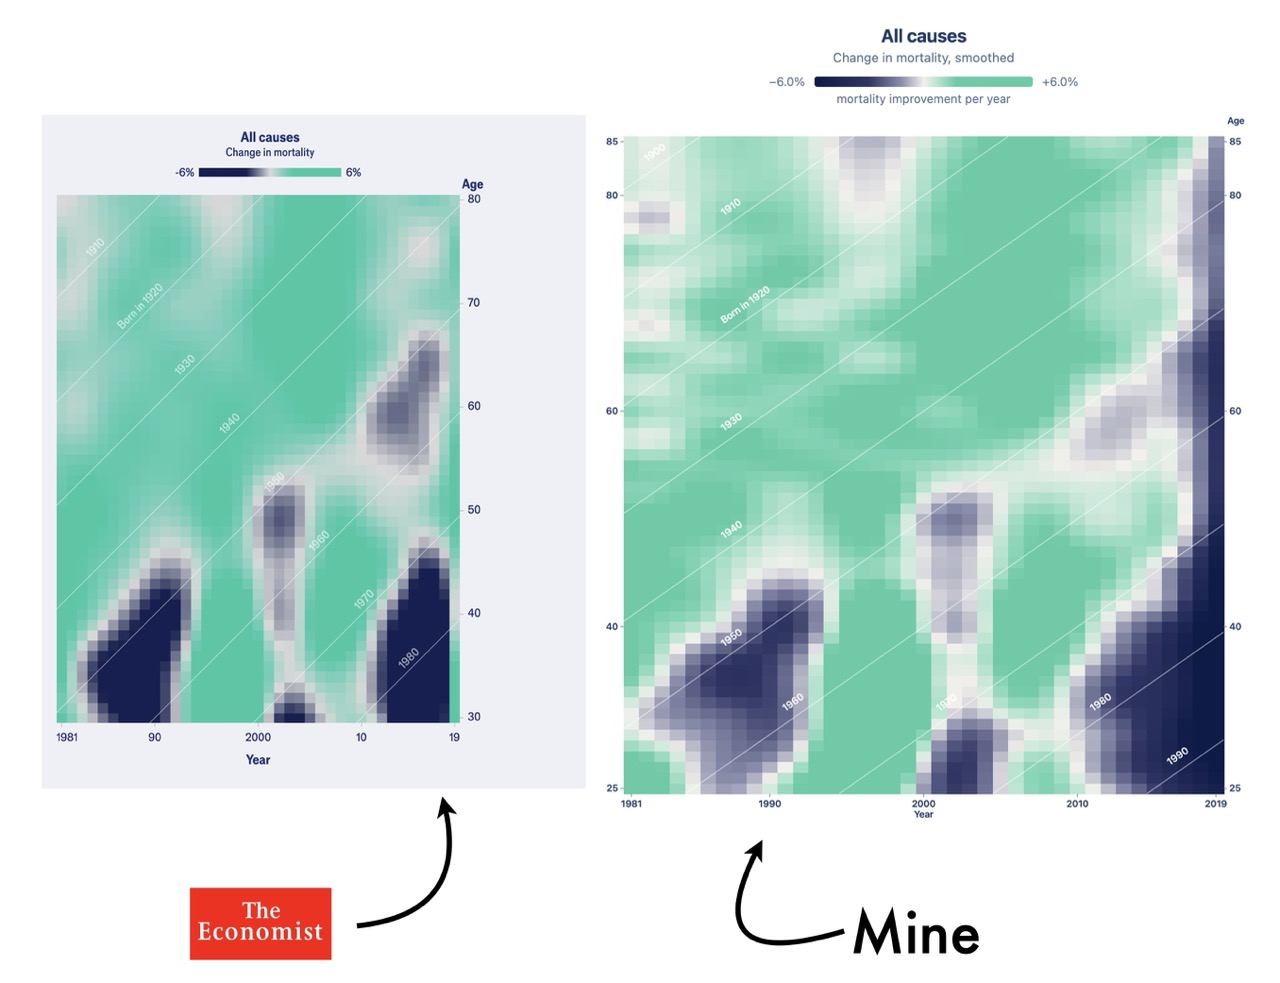
Then the same for the cause-specific panels in the paper. The rectangle highlights The Economist’s age and year range.
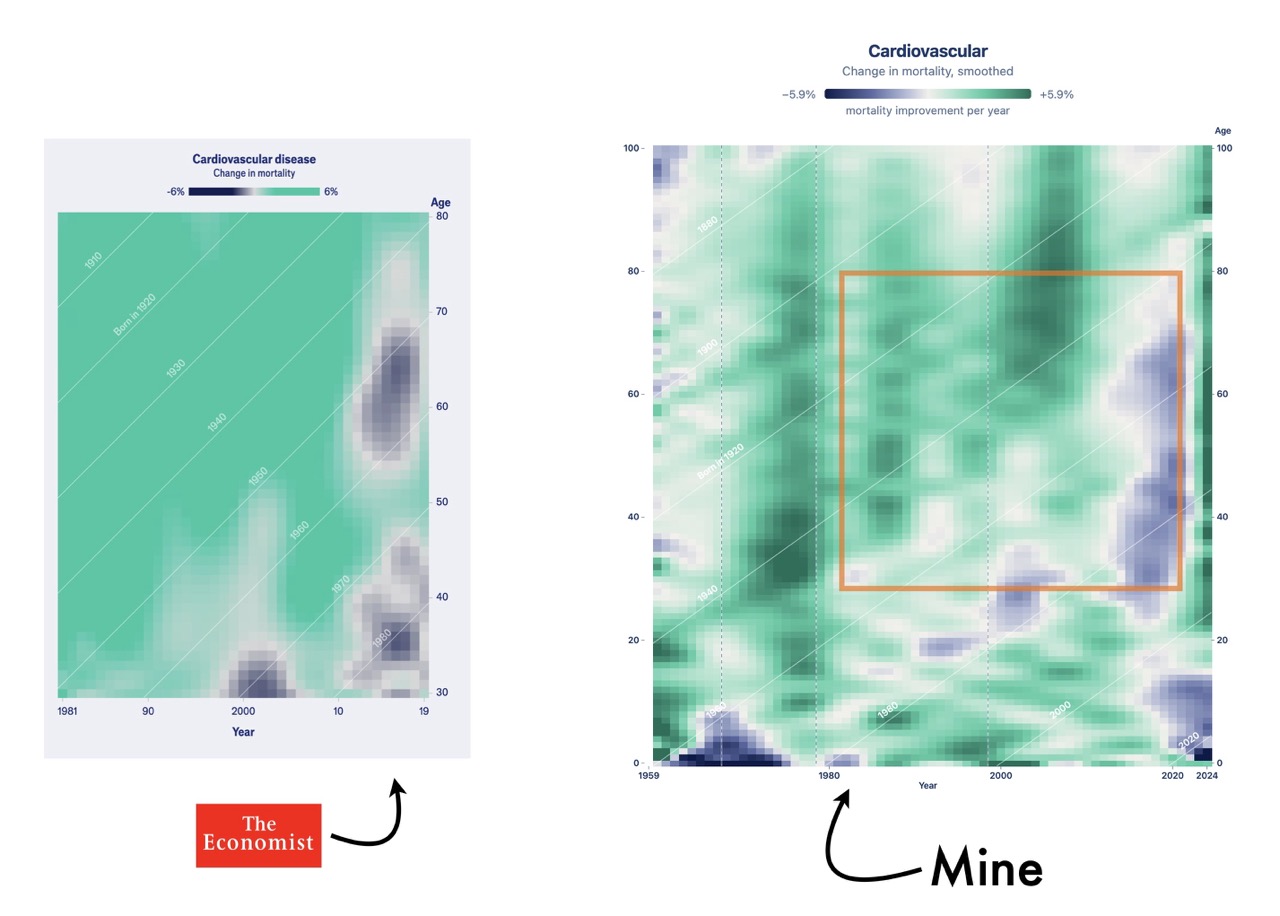
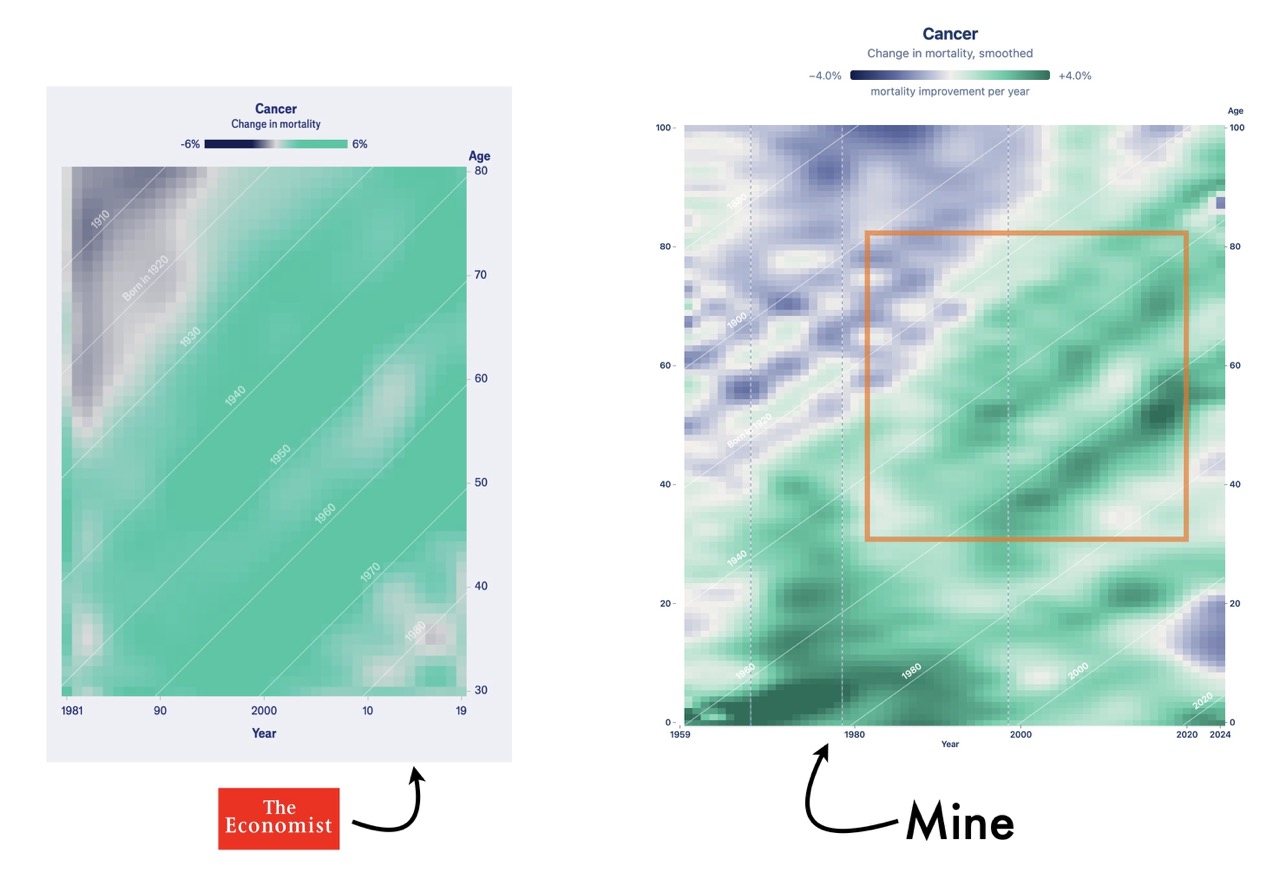
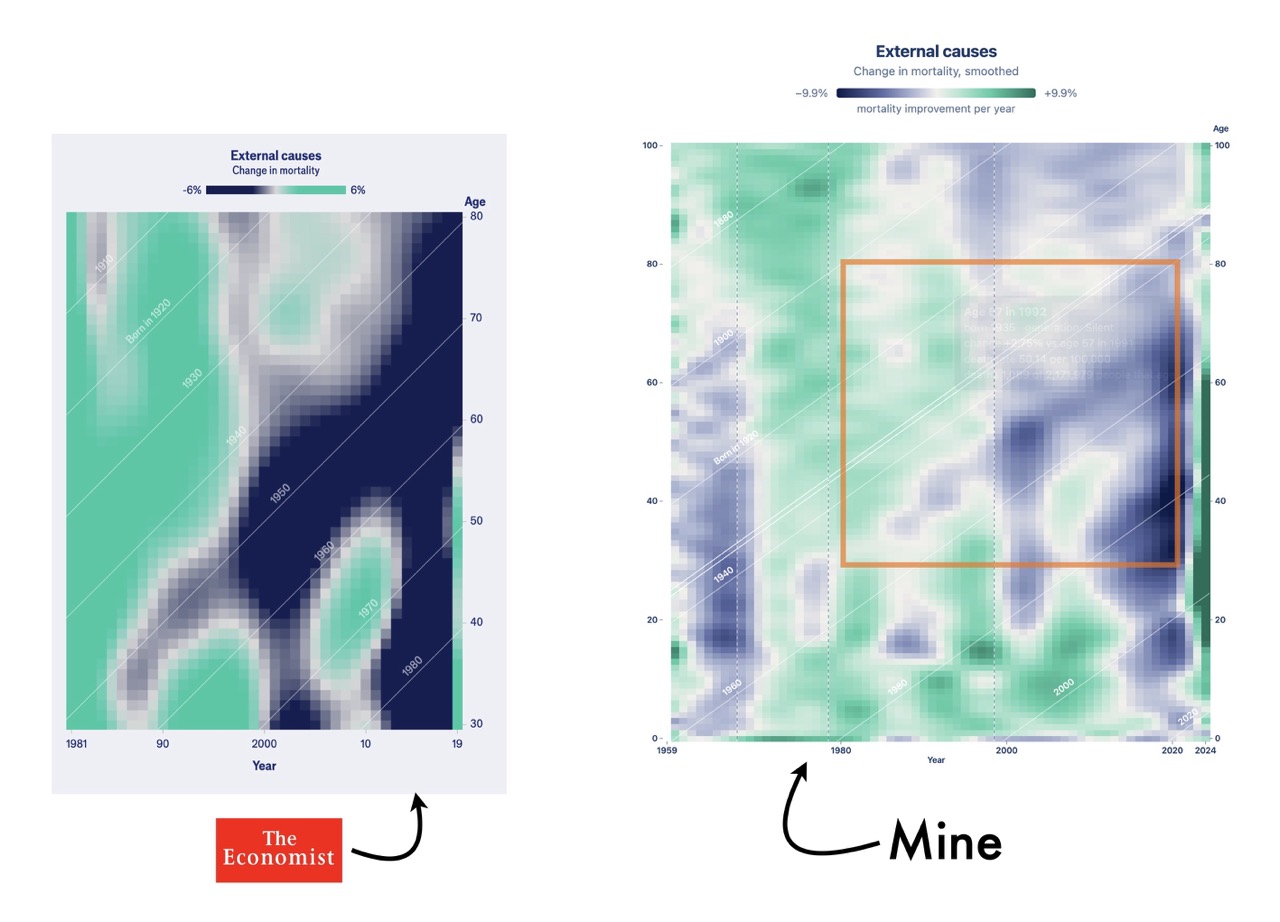
Slight differences, but mostly spot on. I think the differences are mainly due to my scale not being fixed across plots, which gives mine more shading and color contrast.
An Interactive Version
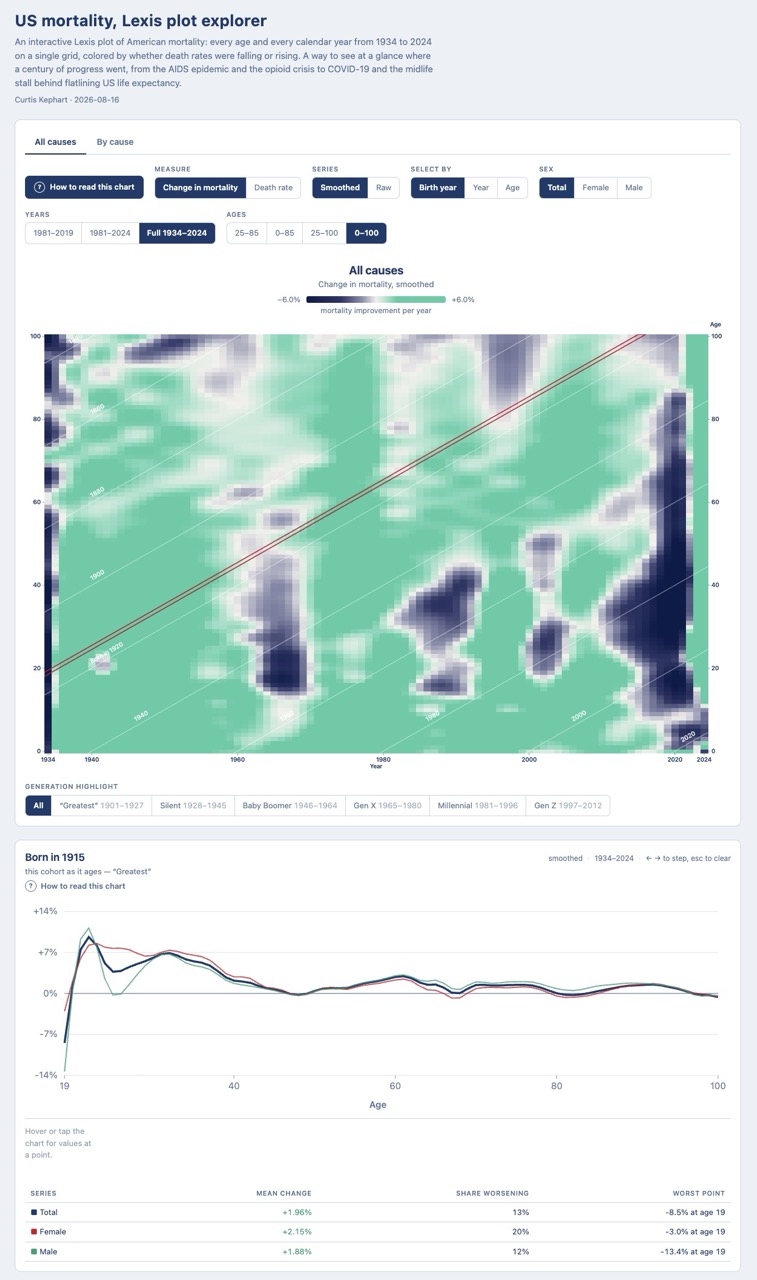
Check out the US Mortality explorer - an interactive Lexis diagram of death rates in the US.
The obvious next thing to do was to let me ask my own questions of it, so I built an interactive version.
The original covers 1981 to 2019 and ages 30-80, all causes, both sexes. Mine runs 1934 to 2024, splits by sex, and adds two things the static figure could not.
The raw numbers, not just the smoothed ones. The published plot is smoothed, which is the right choice for print: it makes the pattern a little more legible. But a smoother has to guess at the edges and it struggles where the data is thin, so it can invent a little structure and hide a little noise. The raw view is the plain year-on-year change, no model. It is harder to read, and honest about how much of the pattern is really there.
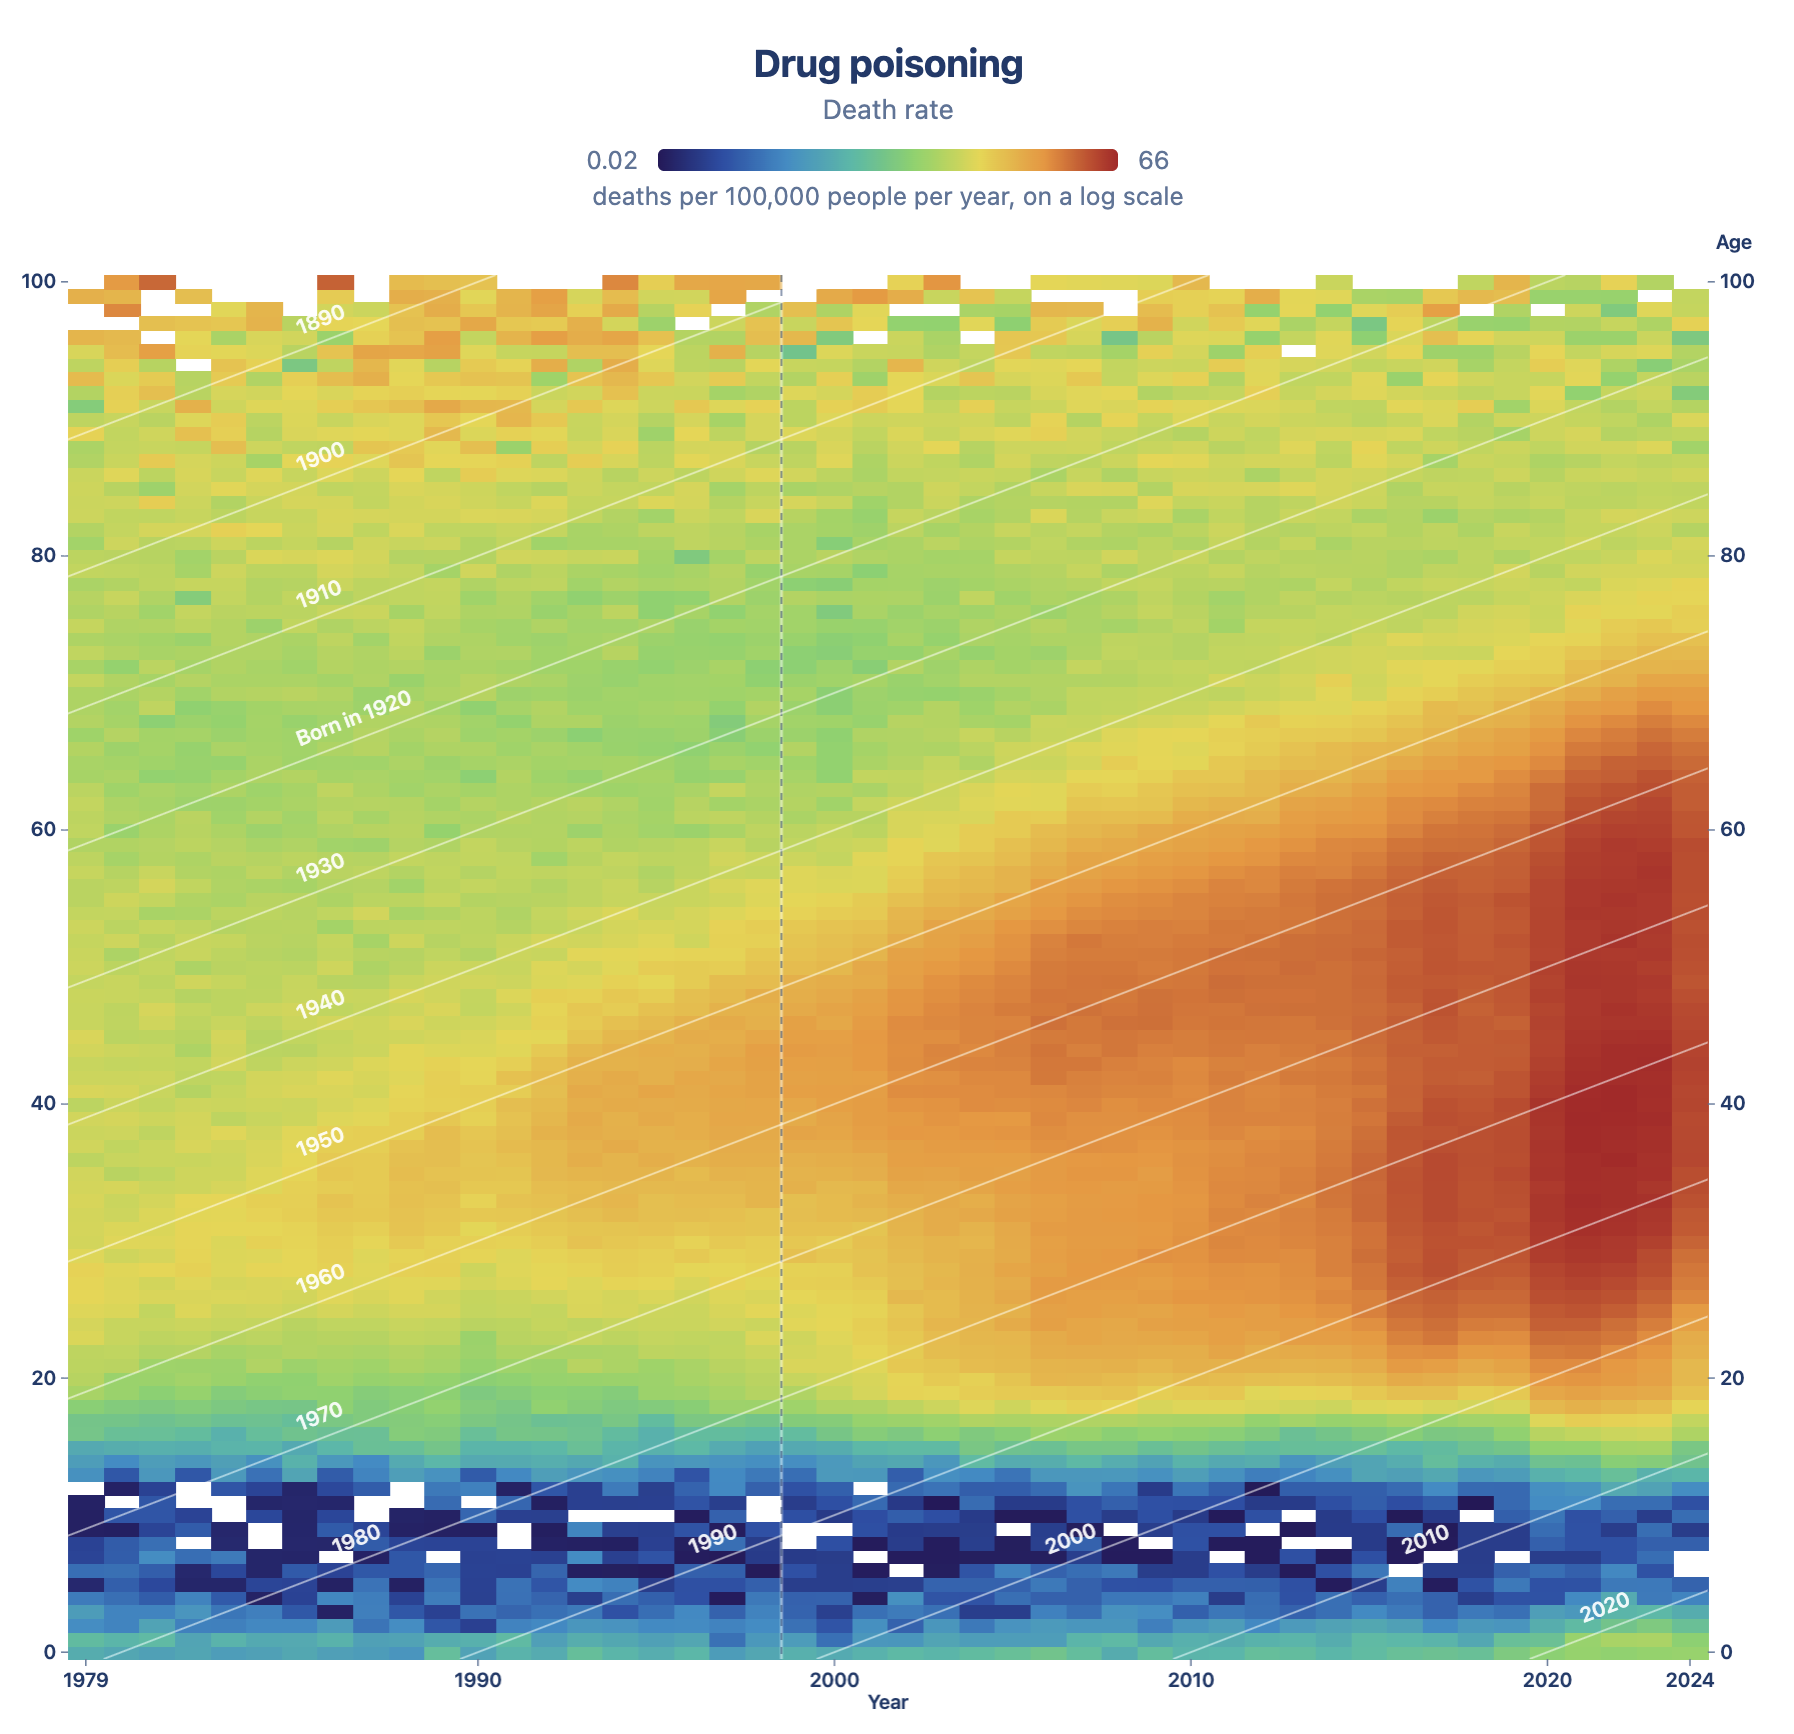
You can also switch from change to the underlying death rate, which is the level rather than the direction. The rainbow gradient means old age at the top in red, childhood at the bottom in blue, and the long blue drift rightward along the bottom is a century of children increasingly not dying.
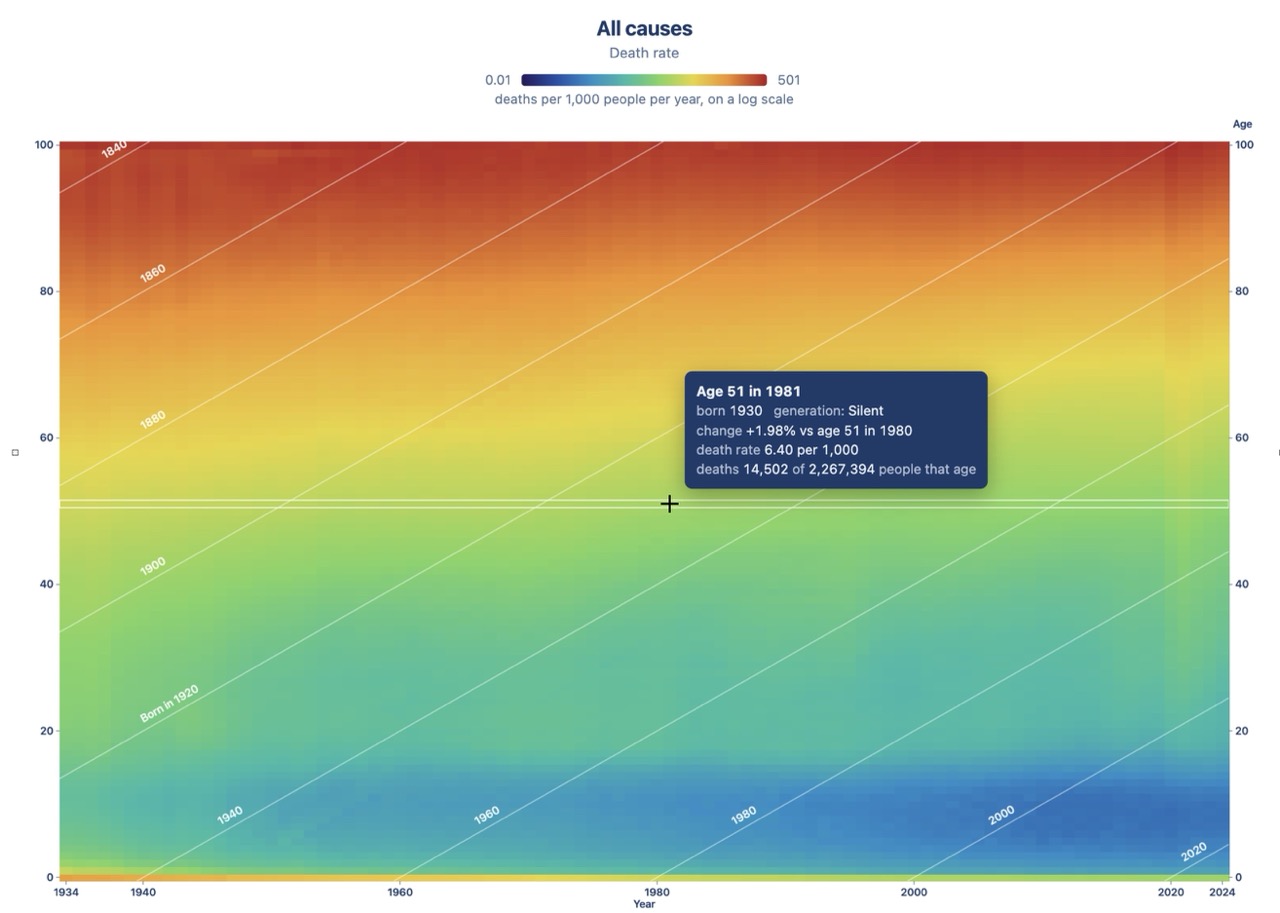
A few other things worth clicking. You can highlight a generation to see its diagonal. You can select by year, by age, or by birth year, and whichever you pick draws a time series underneath the plot with the numbers behind it. There are age and date filters, and on a desktop you can drag a box on the plot to zoom into it.
View mortalities by cause of death
This was a fun part. Every death registered in the United States produces a certificate, and the CDC’s National Center for Health Statistics publishes one record per death going back to 1959, carrying age, sex, year and a cause code. That is sixty-six years and about 150 million records, free to anyone who wants them.
They are also distributed as fixed-width text with no column names and a layout that changes every few years, which would have been most of the work. As you might imagine, dealing with all this gets quite complex, nuanced and prone to errors. But research associated with the National Bureau of Economic Research have already done that job for every year and published the result as plain CSVs with named columns. It is a quietly enormous public service and it turned a month of parsing into an afternoon. Thank you, NBER.
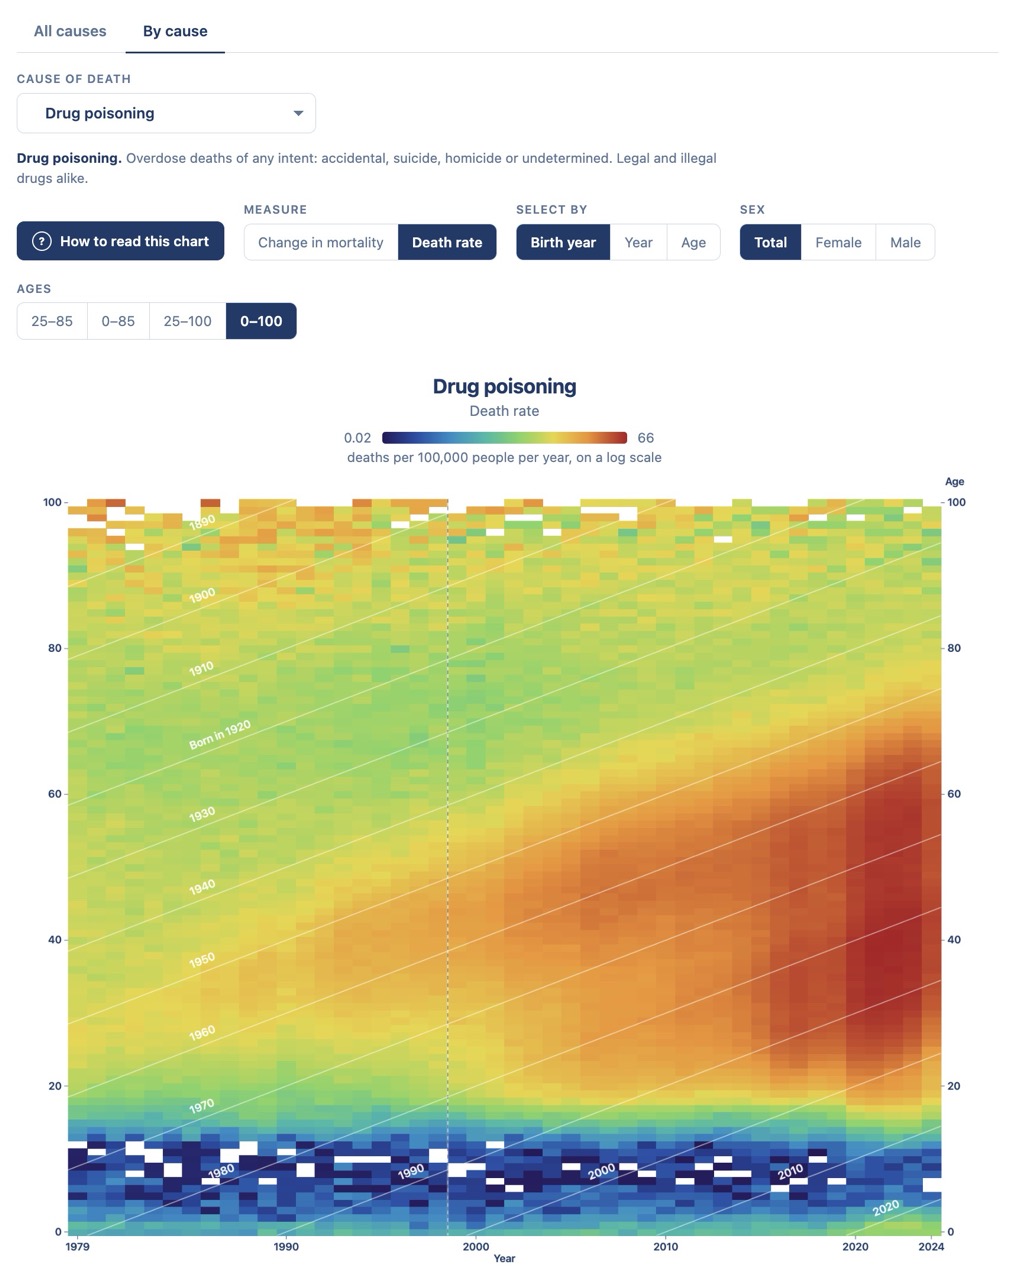
So the interactive version lets you pick a cause: cancer and its major sites, heart disease, stroke, drug poisoning, firearms, suicide, dementia, and a few dozen more.
See the methods, data and code
Check out the interactive Lexis plot explorer of US mortality here. Start with all causes, hit “Full 1934 to 2024” and look at all ages, highlight the boomers, switch to death rates. Click into specific mortality causes.
I also wrote all of this up as notebooks:
US mortality change on a Lexis plot: all causes. Replication of The Economist (2026-07-17) / Abrams et al. (2026) figures.
US mortality by cause of death, on the Lexis plot. Death rates and annual change, by age and year, for fifty causes.
And if you want to bring me a little joy, please leave a comment about how baffled and befuddled you are by the data visualization. 0/10 bad plot.
Not to be morbid, but some US mortality highlights
HIV/AIDS
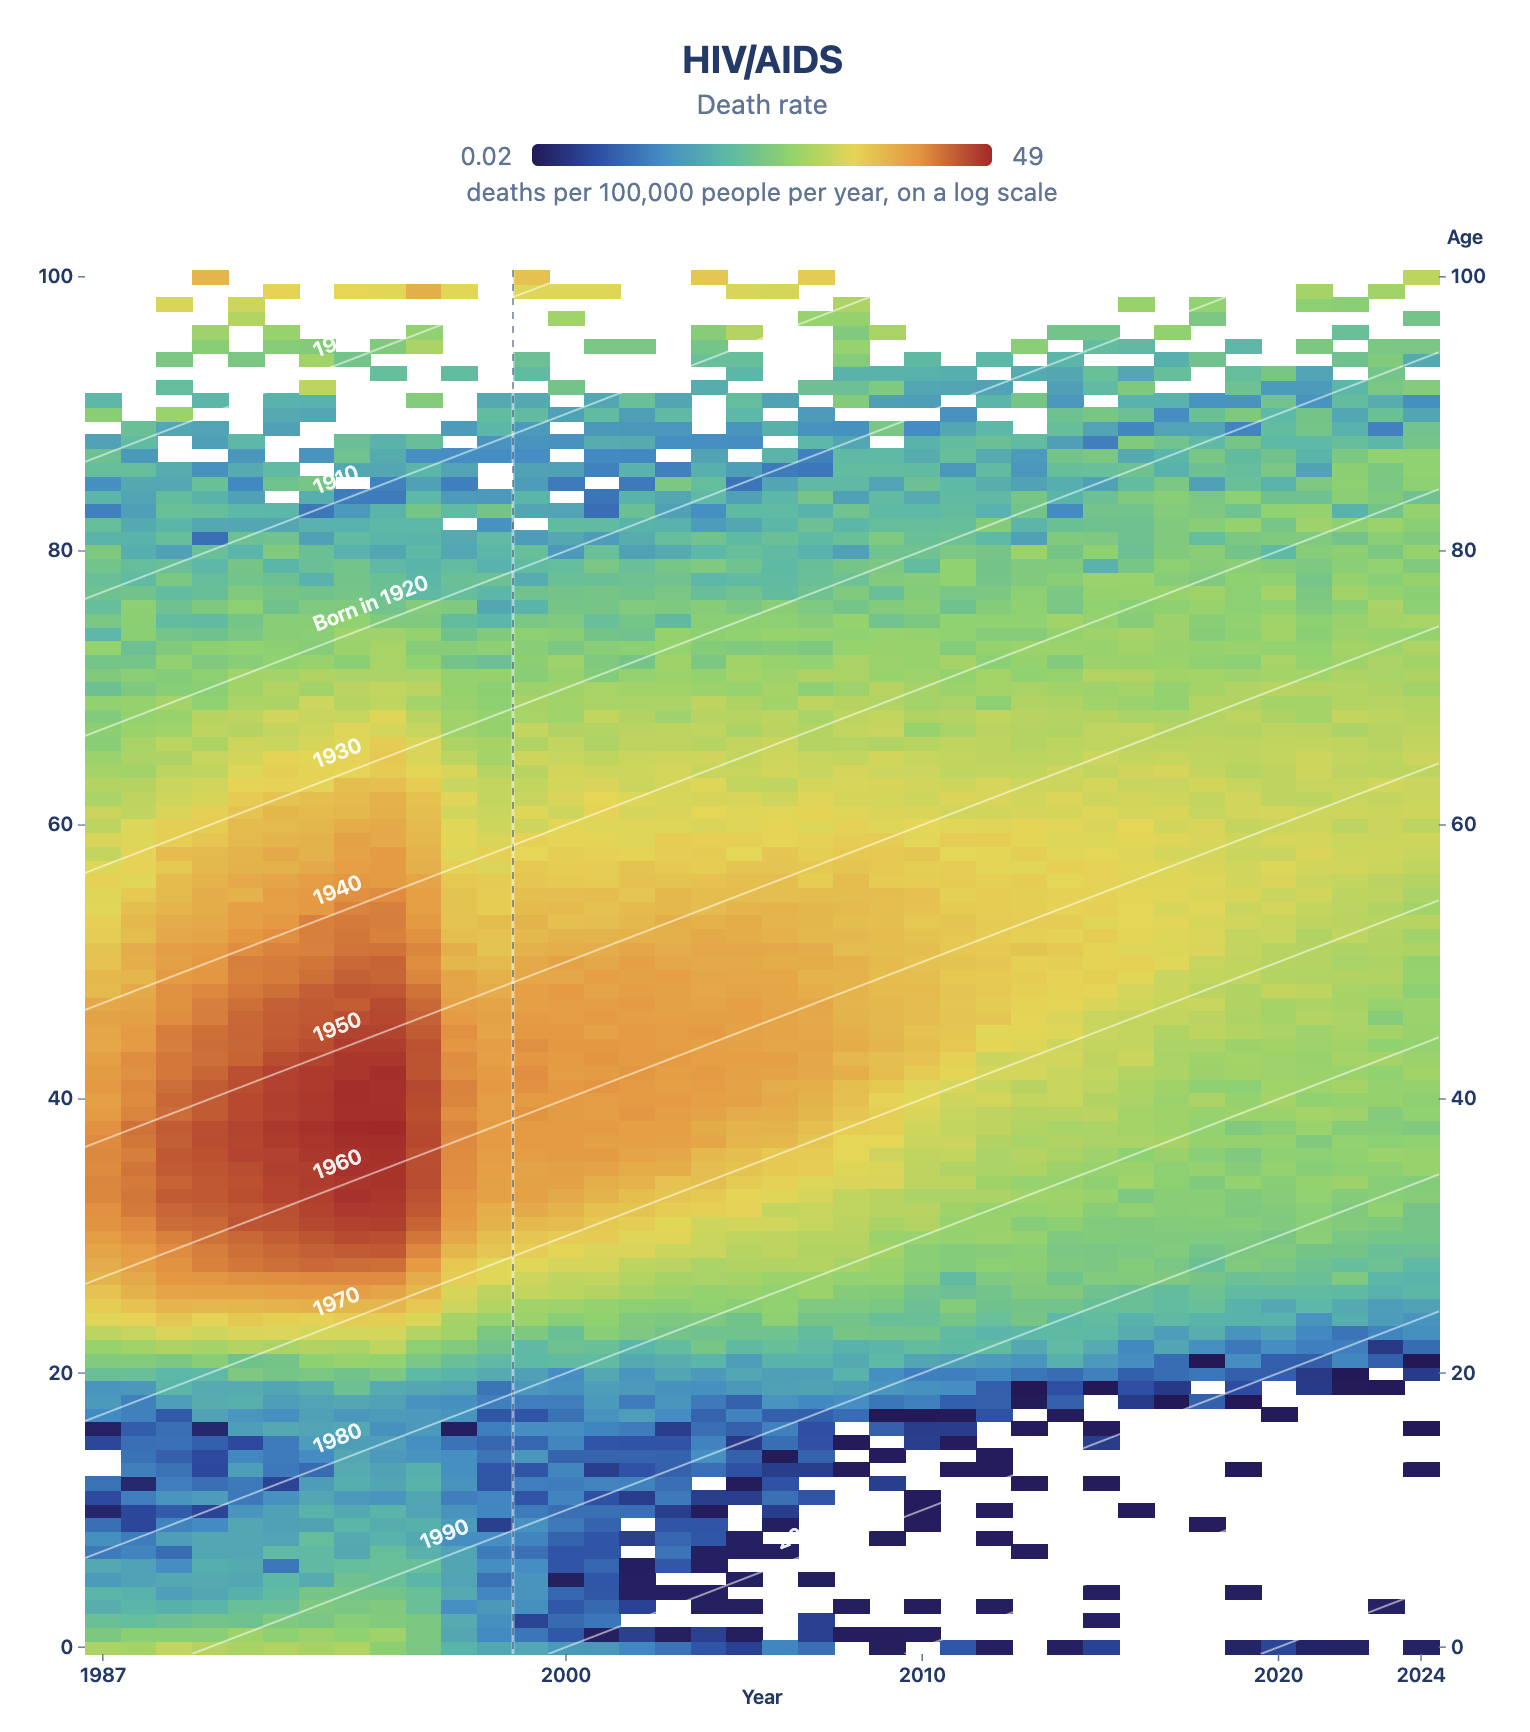
Note the band of worsening mortality for young adult ages through the 1980s and early 1990s, then a reversal after 1996. It’s so sharp it is hard to believe it is the same series. Deaths peak at 43,107 in 1995 and fall to 16,510 by 1997. A very scary outbreak and impressive reversal.
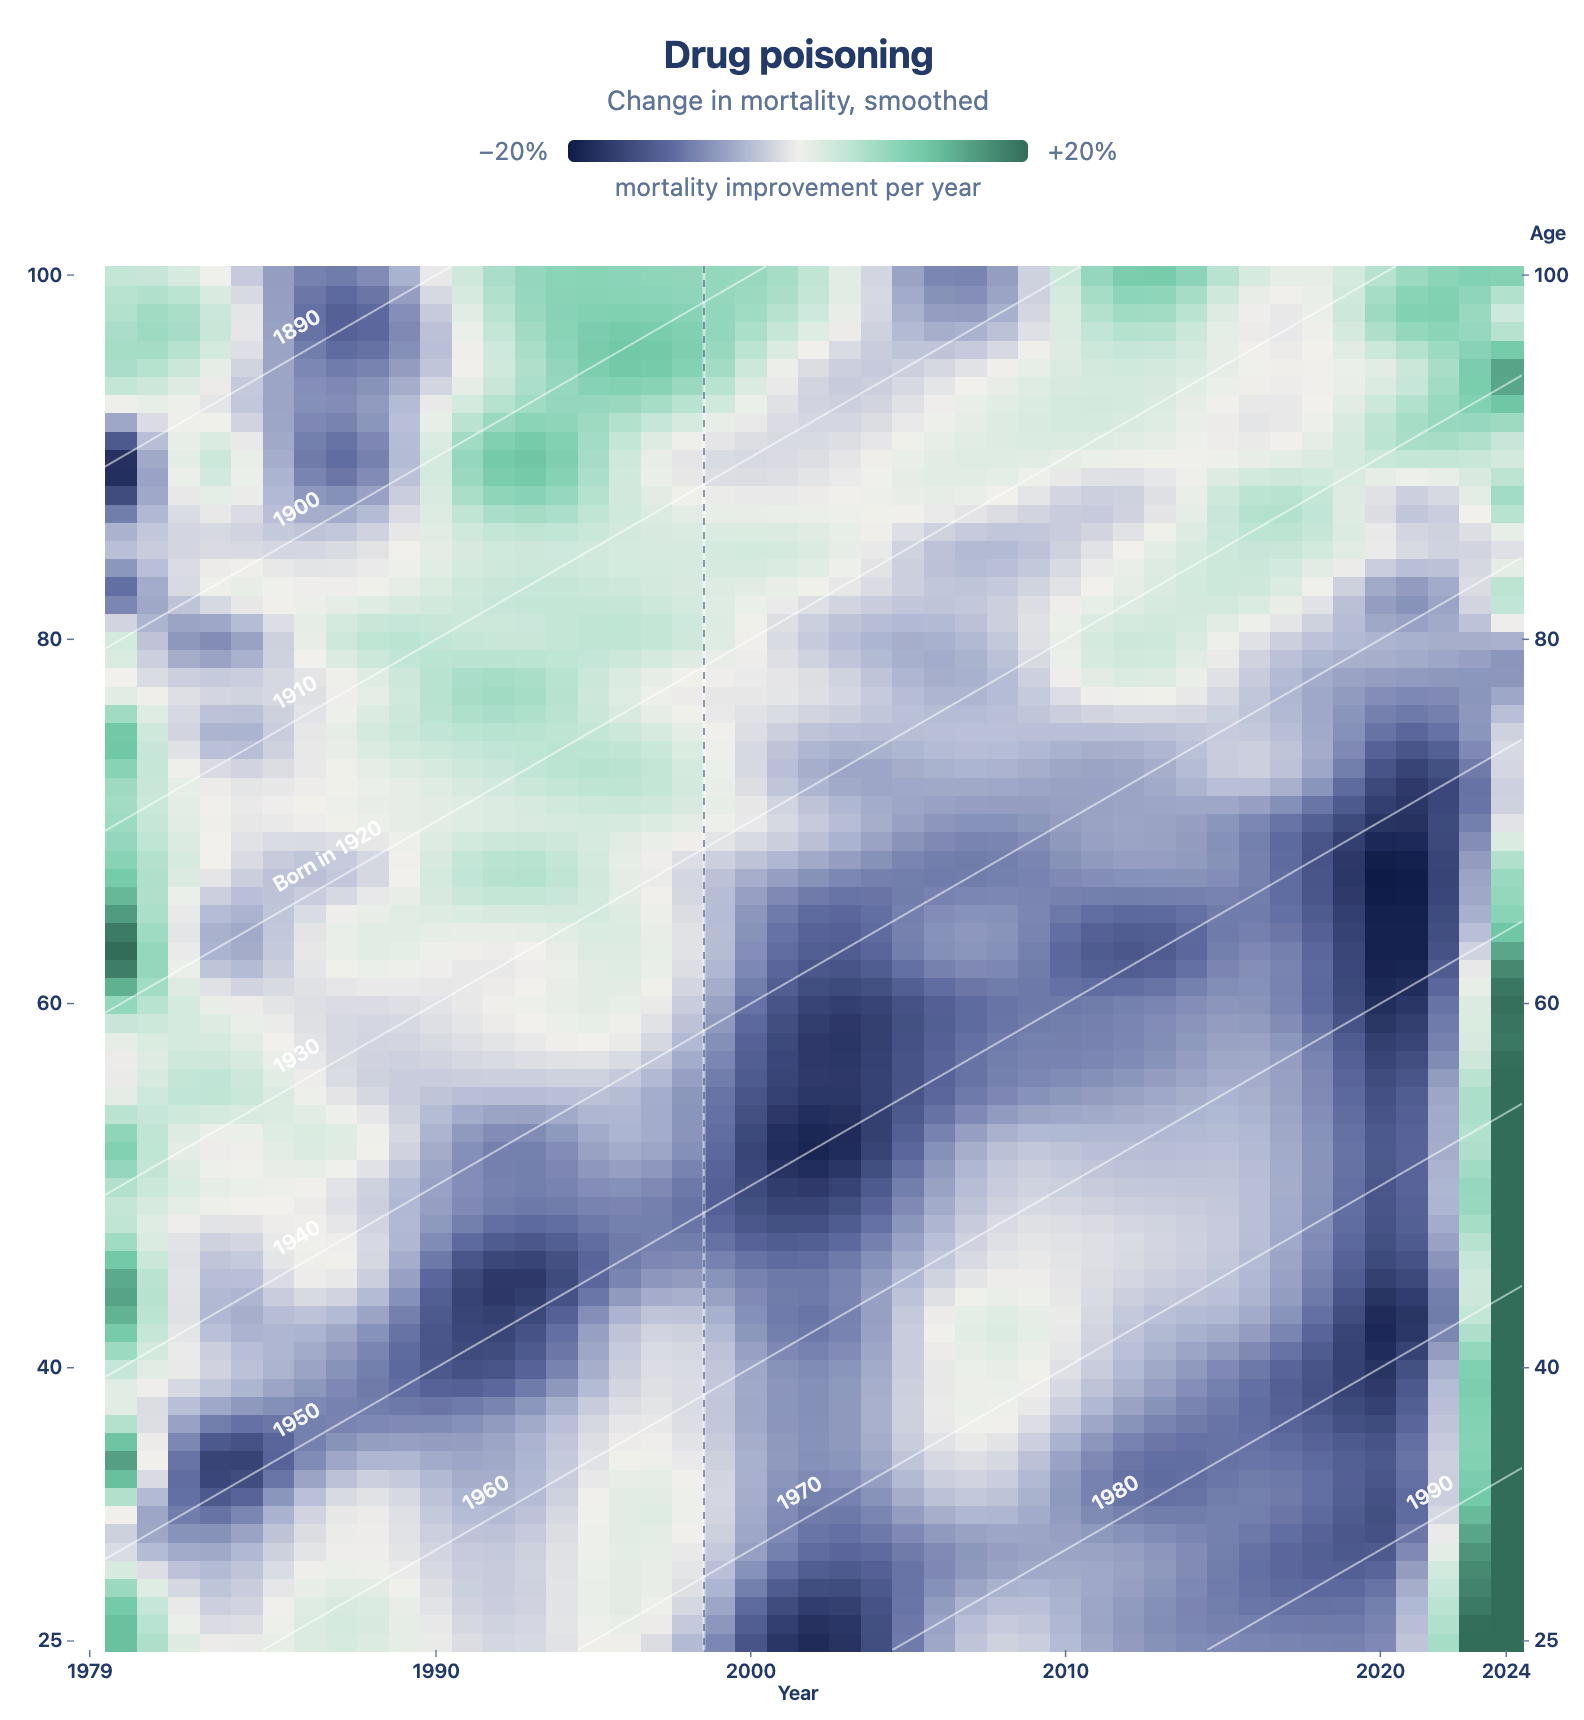
Drug poisonings
The opioid crisis appears in two waves: a narrow band around 1999–2006, followed by a much stronger one beginning around 2011. Drug-poisoning deaths rose from 6,873 in 1979 to 16,833 in 1999, 70,622 in 2019, and 106,689 in 2021.
Note also the generational boundaries that seem to shape the rise in drug poisonings. Rates begin rising sharply among those born around 1945 and after, forming a clear diagonal line starting with that generation.
And note the large increase among 18–65-year-olds from 2020–2023. Scary times.
COVID-19
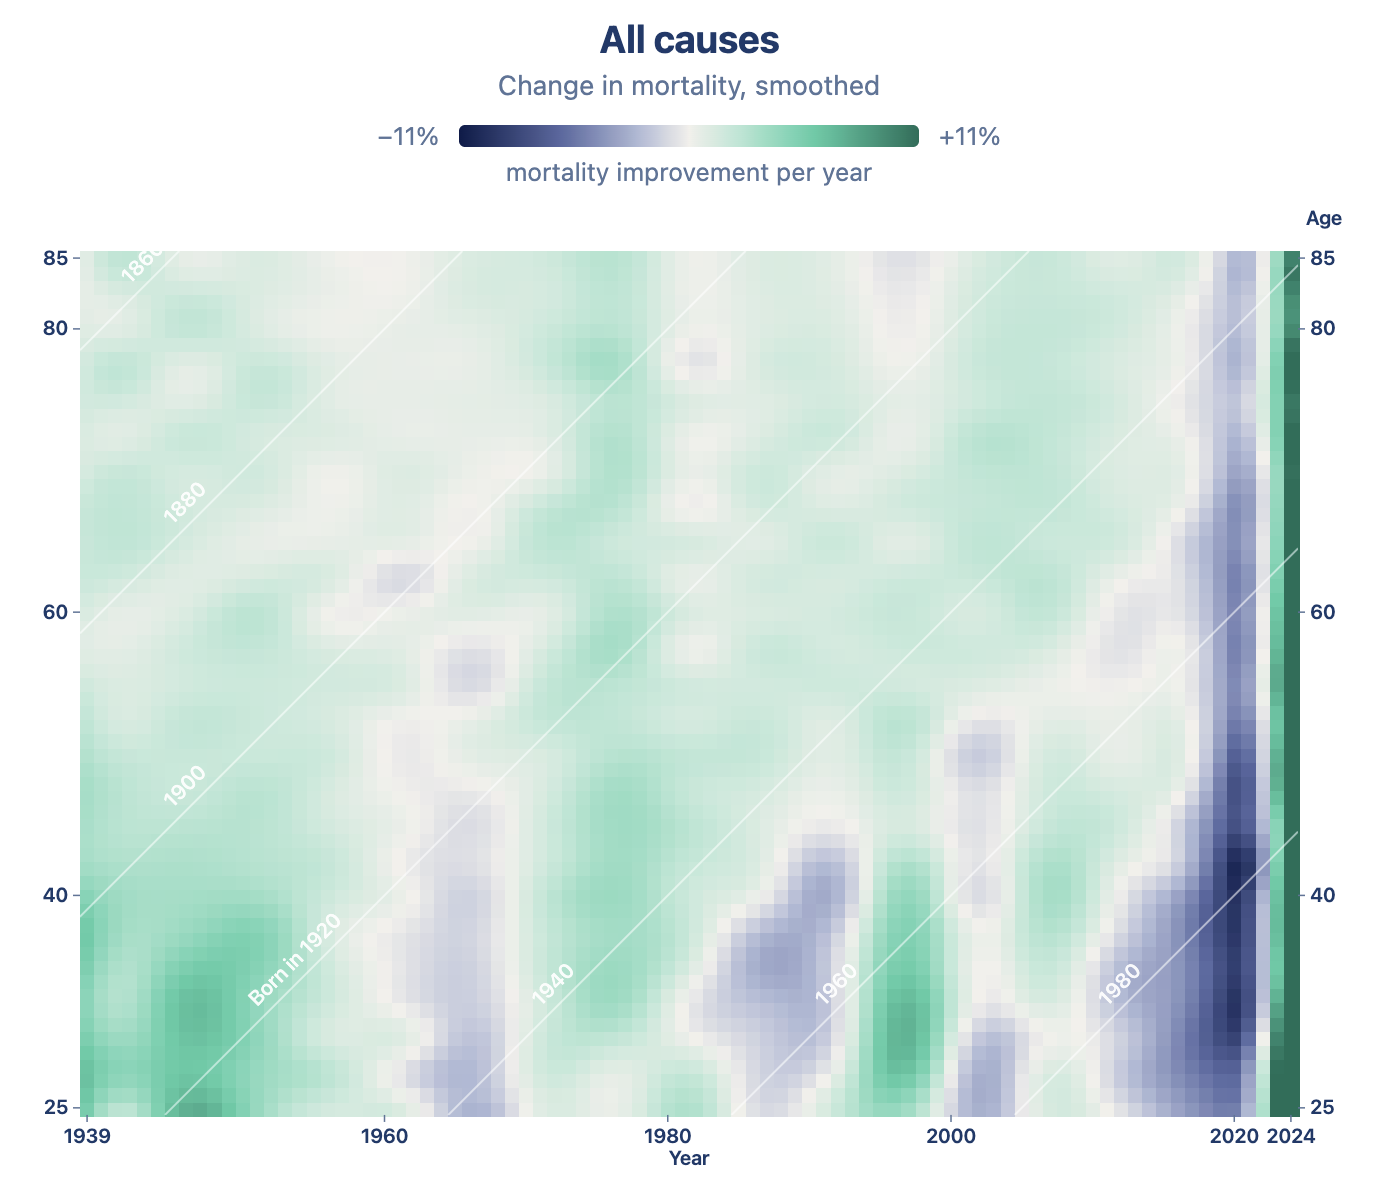
A vertical stripe. Every age at once, in the same year, which is exactly what a cohort effect does not look like. The 2020 column is the darkest thing on the plot by a wide margin: about -18% averaged across adult ages, roughly three times worse than any other year in the modern record.
Guns
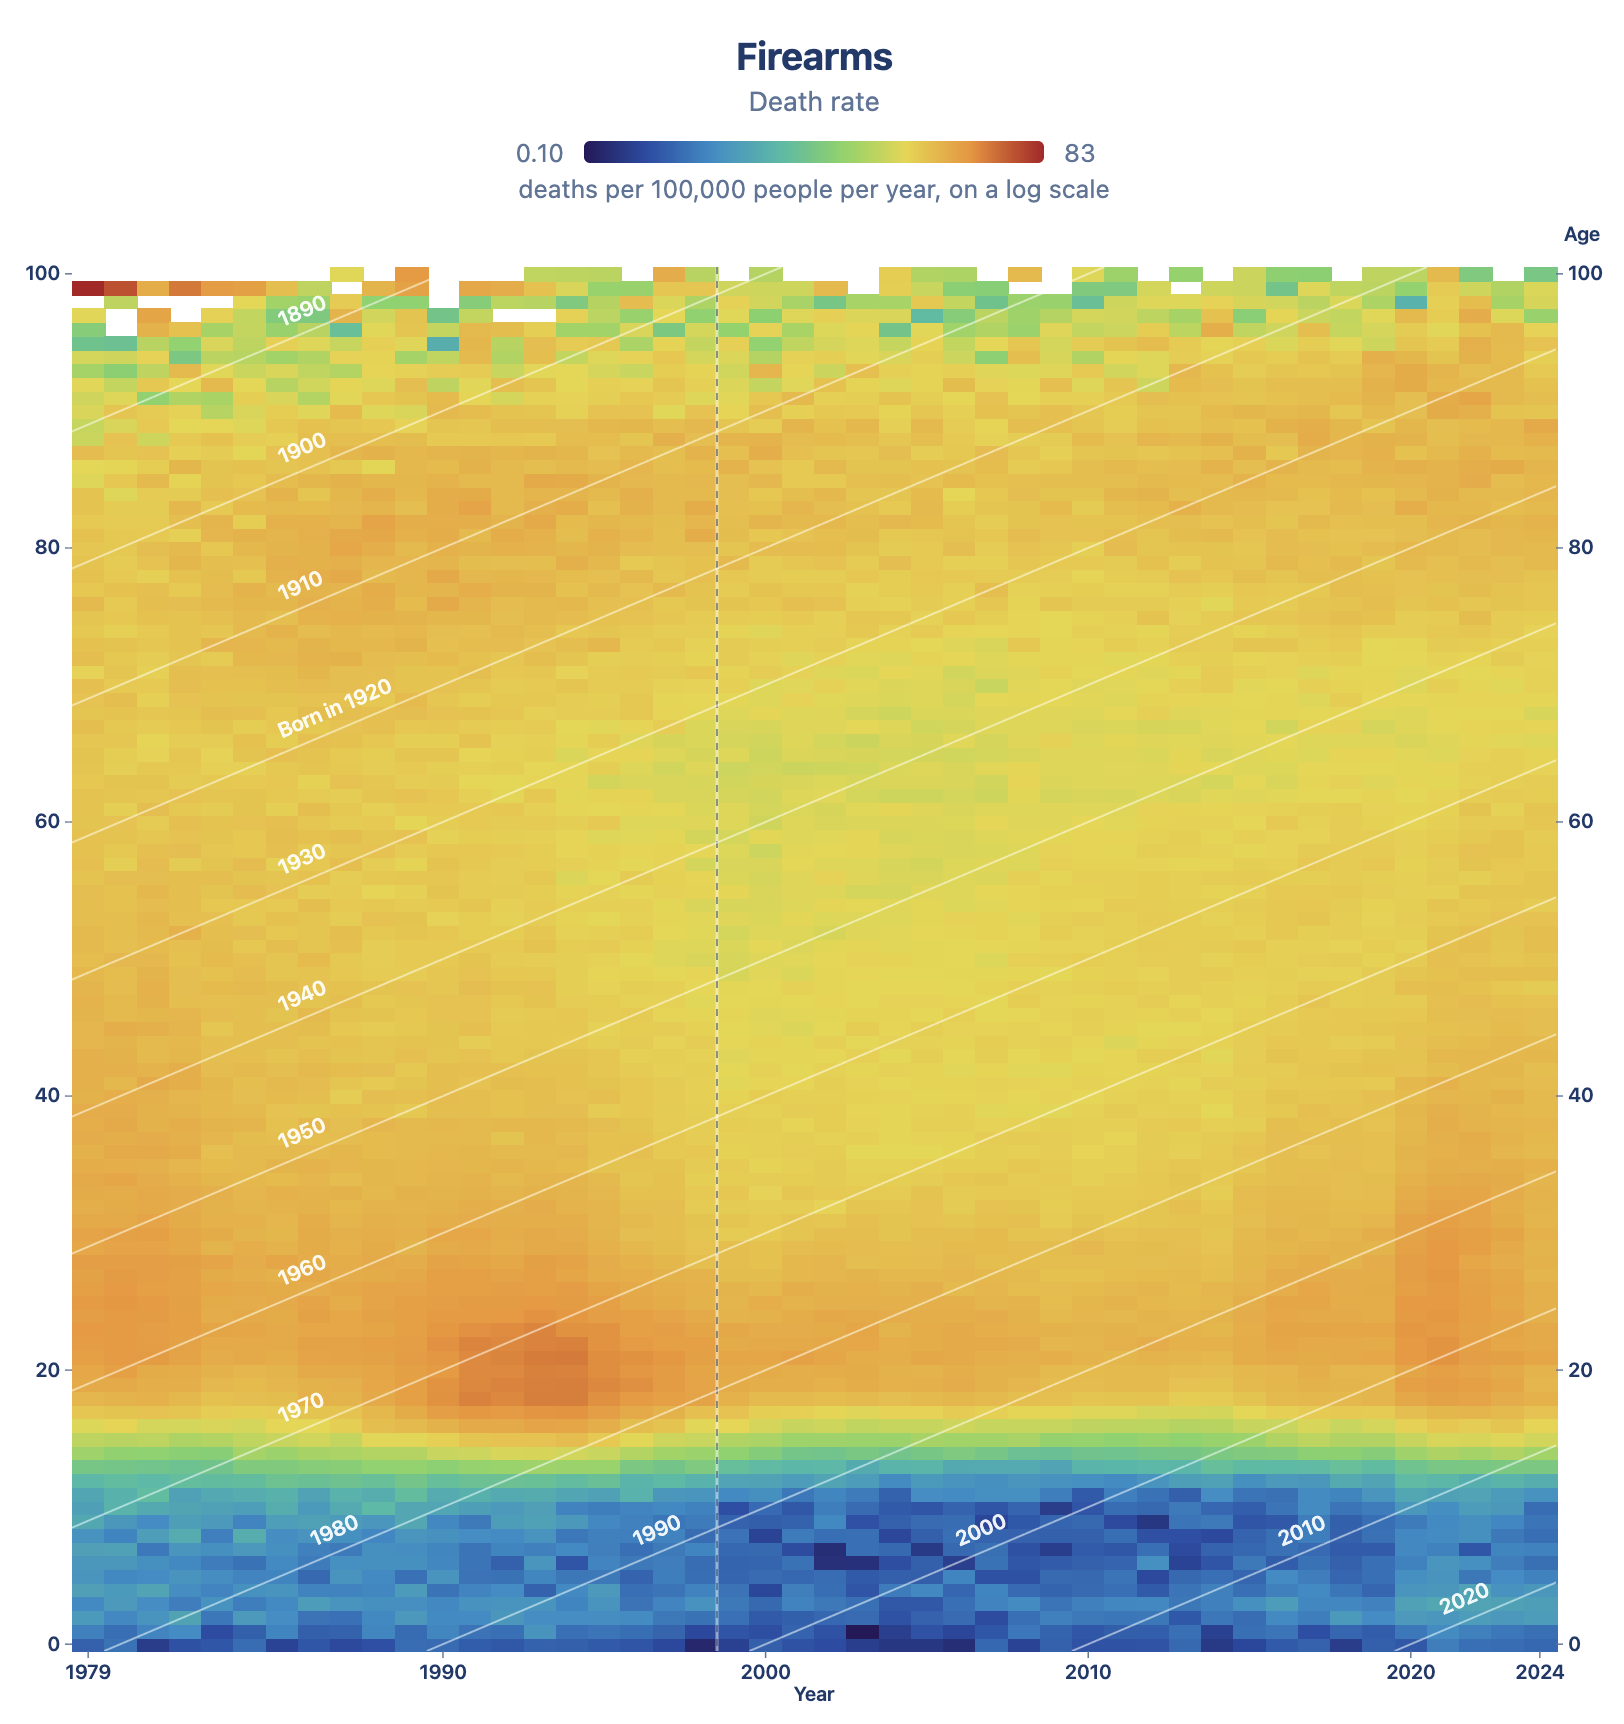
Firearm deaths: 32,671 in 1979, a peak around 1993, a trough near 2000, then back up, to 48,829 by 2021. (Tho this dataset doesn’t go back before 1979, nearly certain firearm stats suggest deaths were well higher in the 1970s.)
Motor vehicles, and the clearest policy signal in the whole dataset
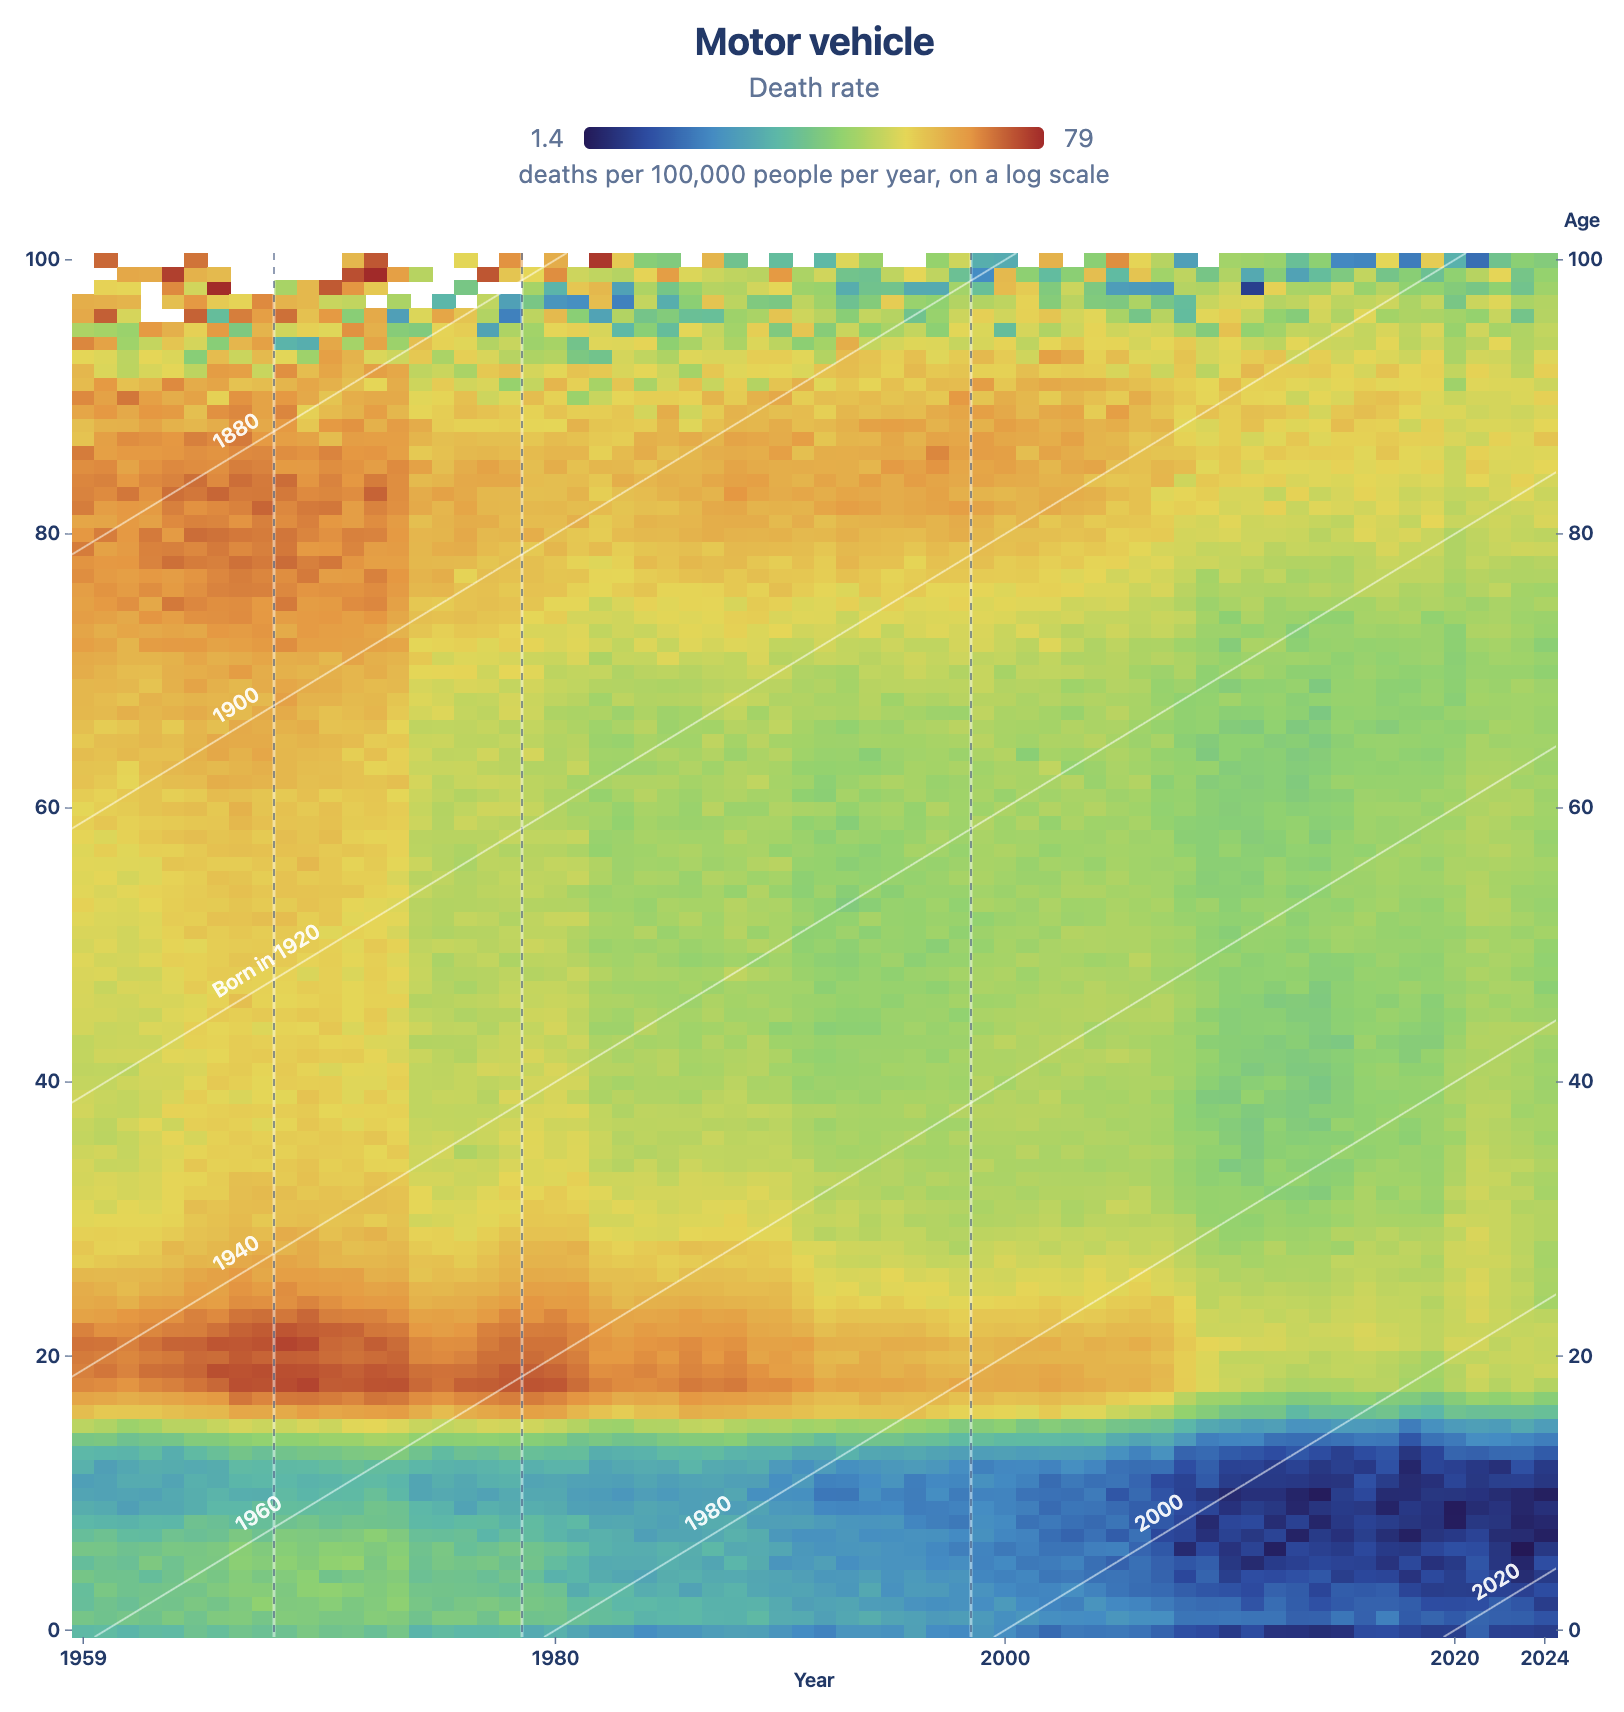
Deaths fall 16% between 1973 and 1974, from 55,483 to 46,383. The national 55 mph speed limit took effect on 2 January 1974, in the middle of the oil crisis that curtailed driving. Can’t separate the two effects, but it’s largest single-year drop in the series and the drop in the rate was maintained for the rest of the series.
A Tale of two generations
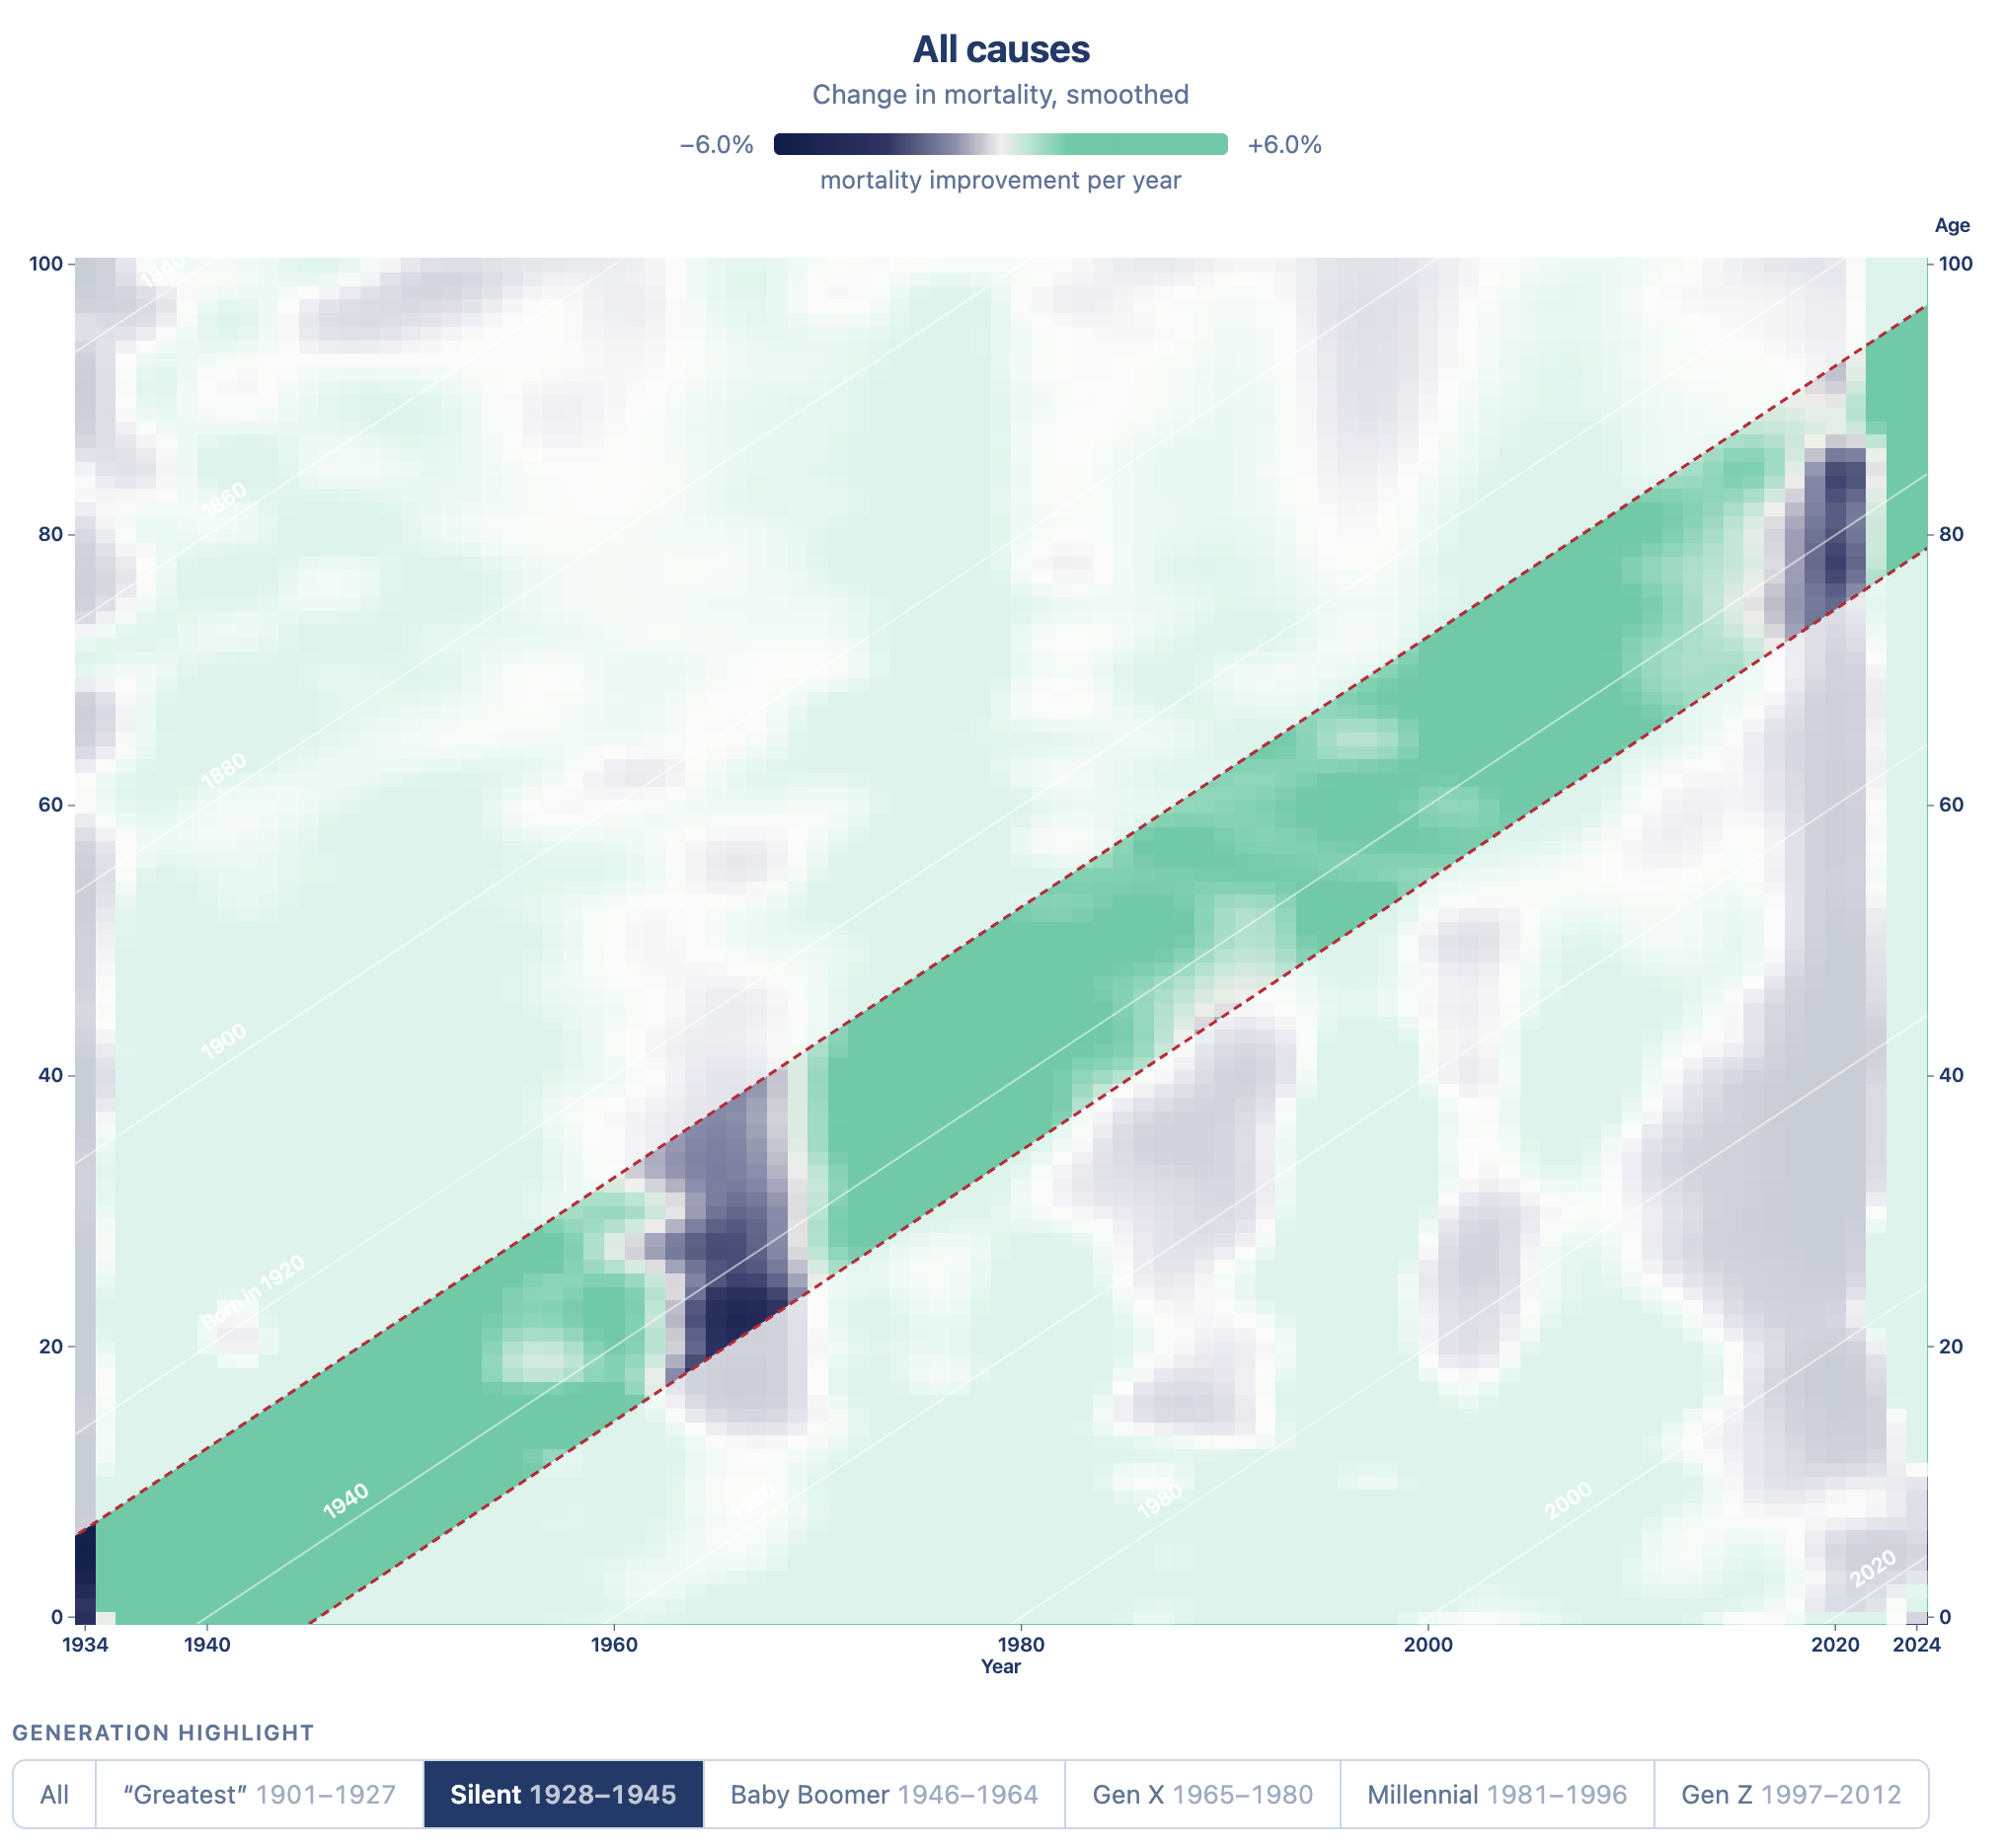
The Silent Generation had a remarkable run. Their diagonal is green for most of its length.
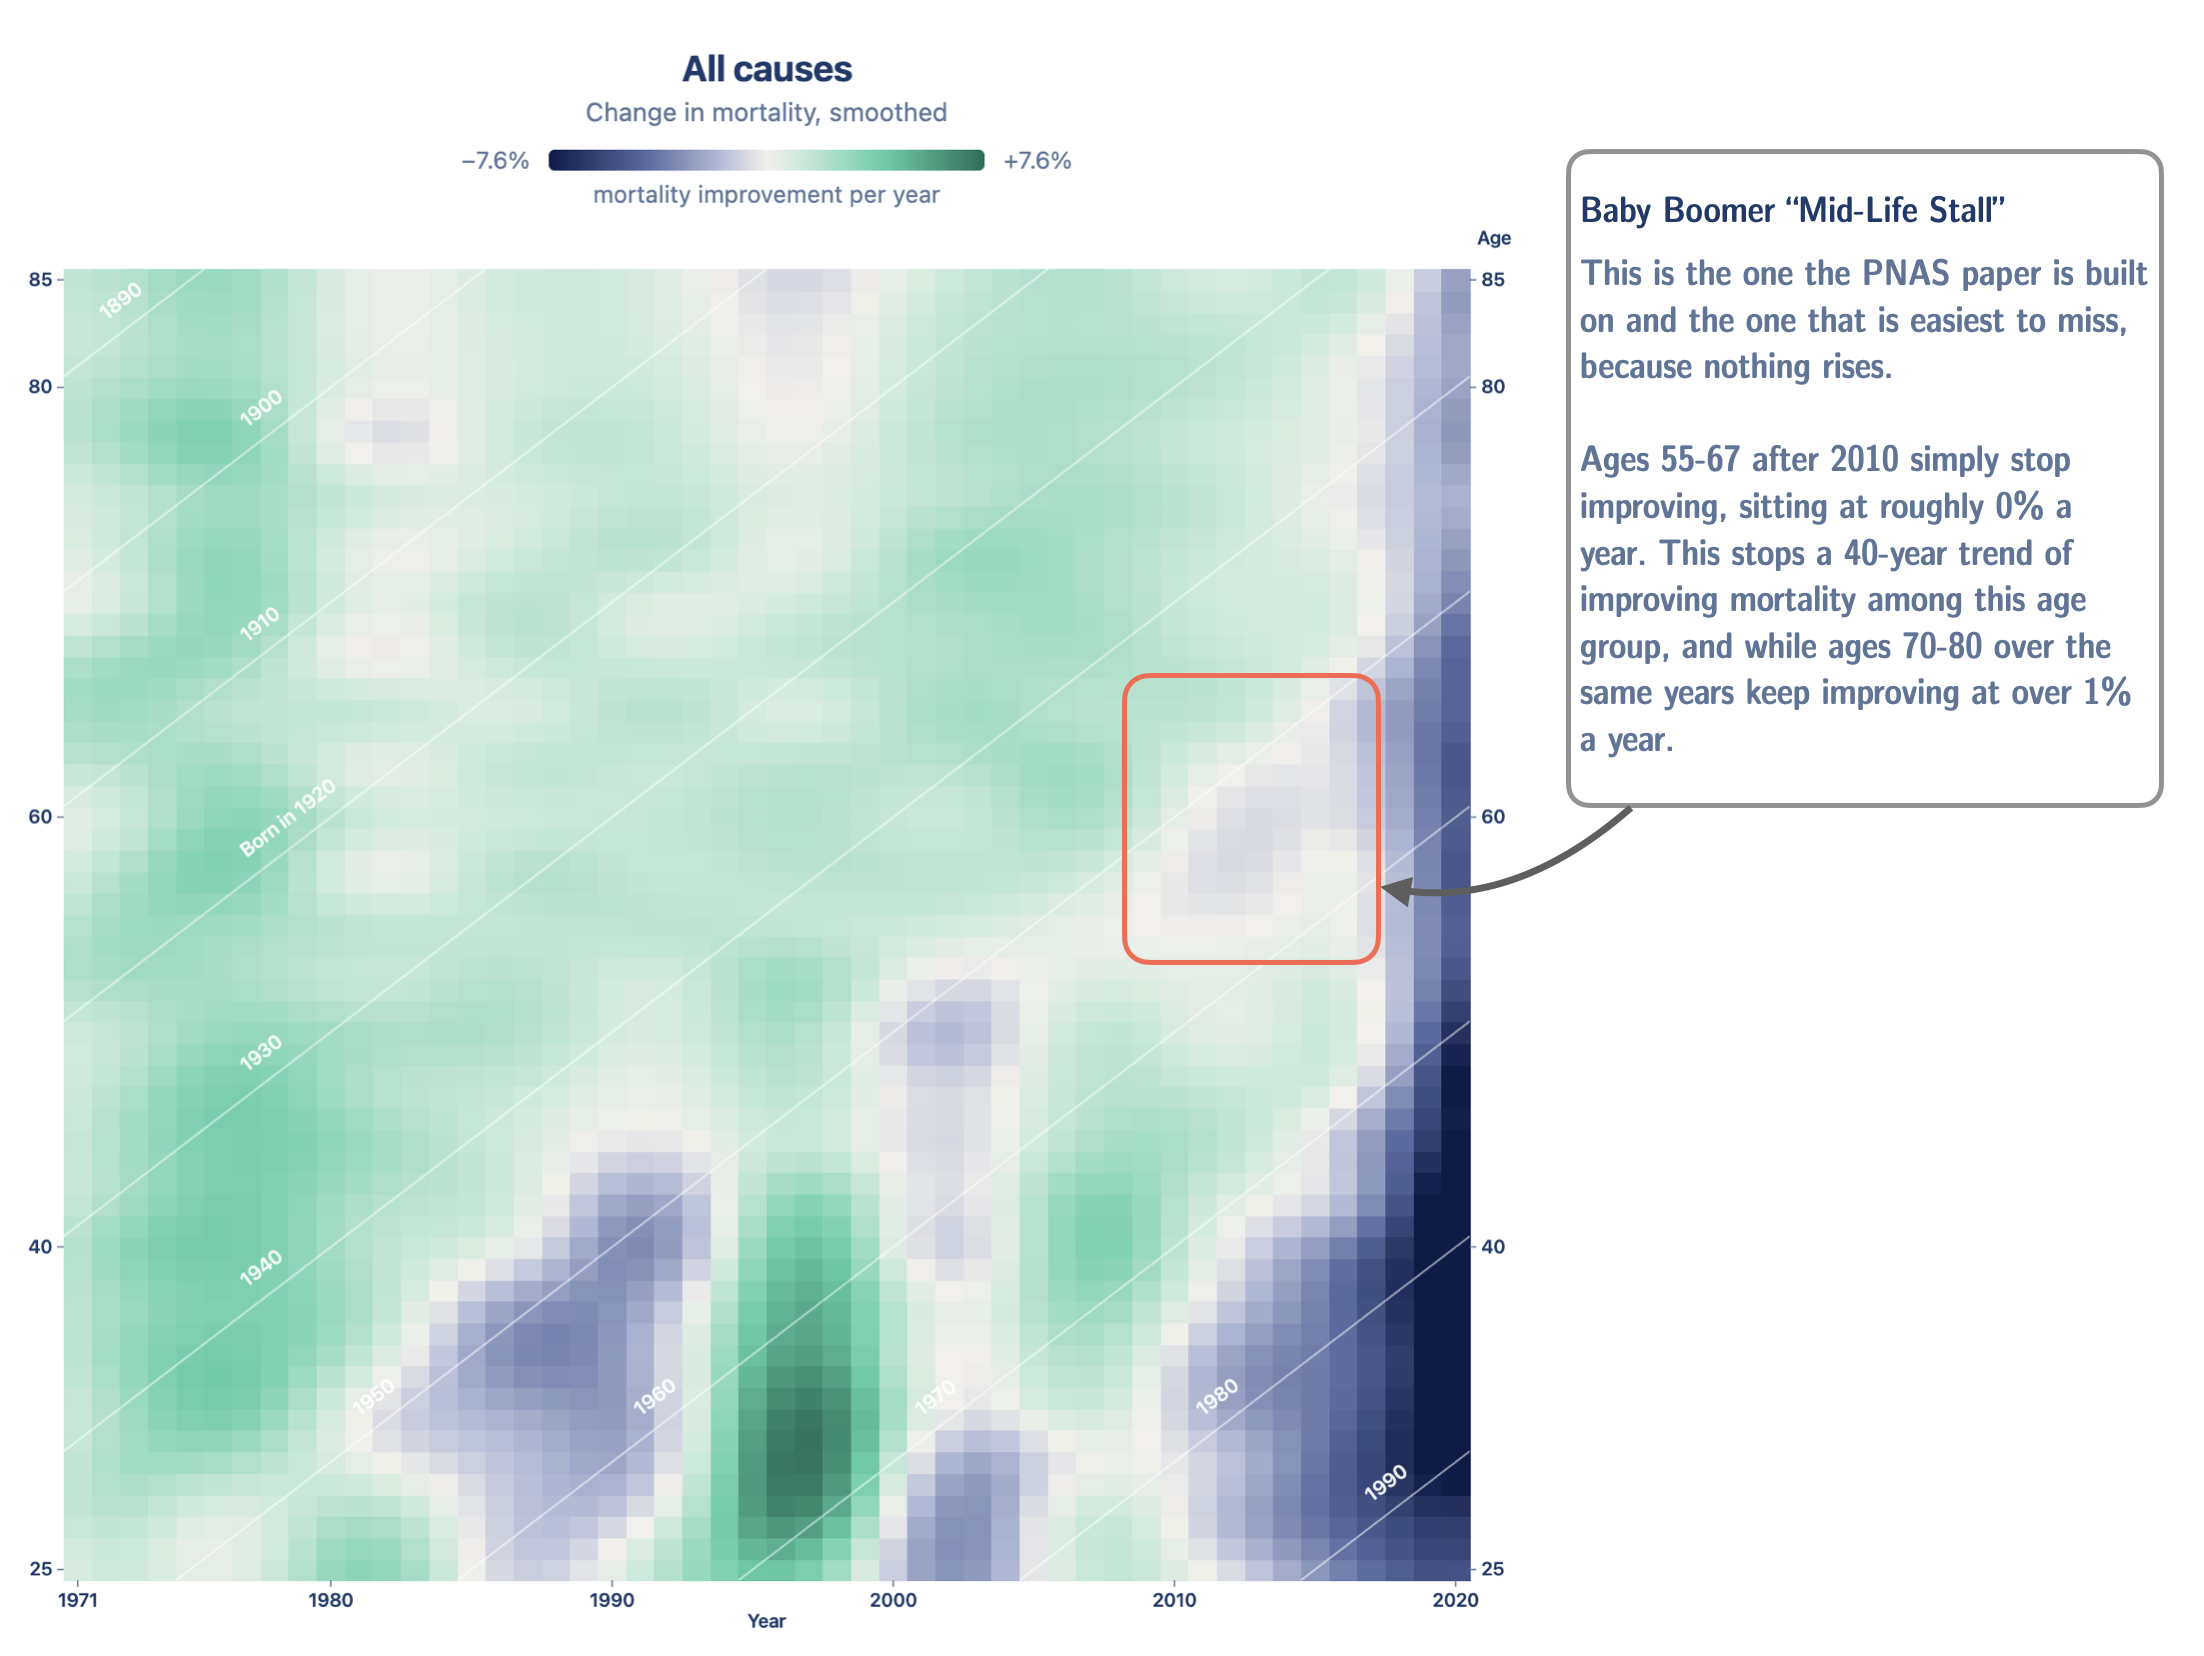
Baby Boomers, less so. So many mortality causes line up with this group.
The midlife stall
This is the one the PNAS paper is built on and the one that is easiest to miss, because nothing rises. Ages 55-67 after 2010 simply stop improving, sitting at roughly 0% a year. This stops a 40-year trend of improving mortality among this age group, and while ages 70-80 over the same years keep improving at over 1% a year.